
Uber in London
It was a relatively quiet, short, trading week in the US equity markets with more consolidation below the ~6100 resistance level and the SPX closing down ~0.2% from last week’s Close:
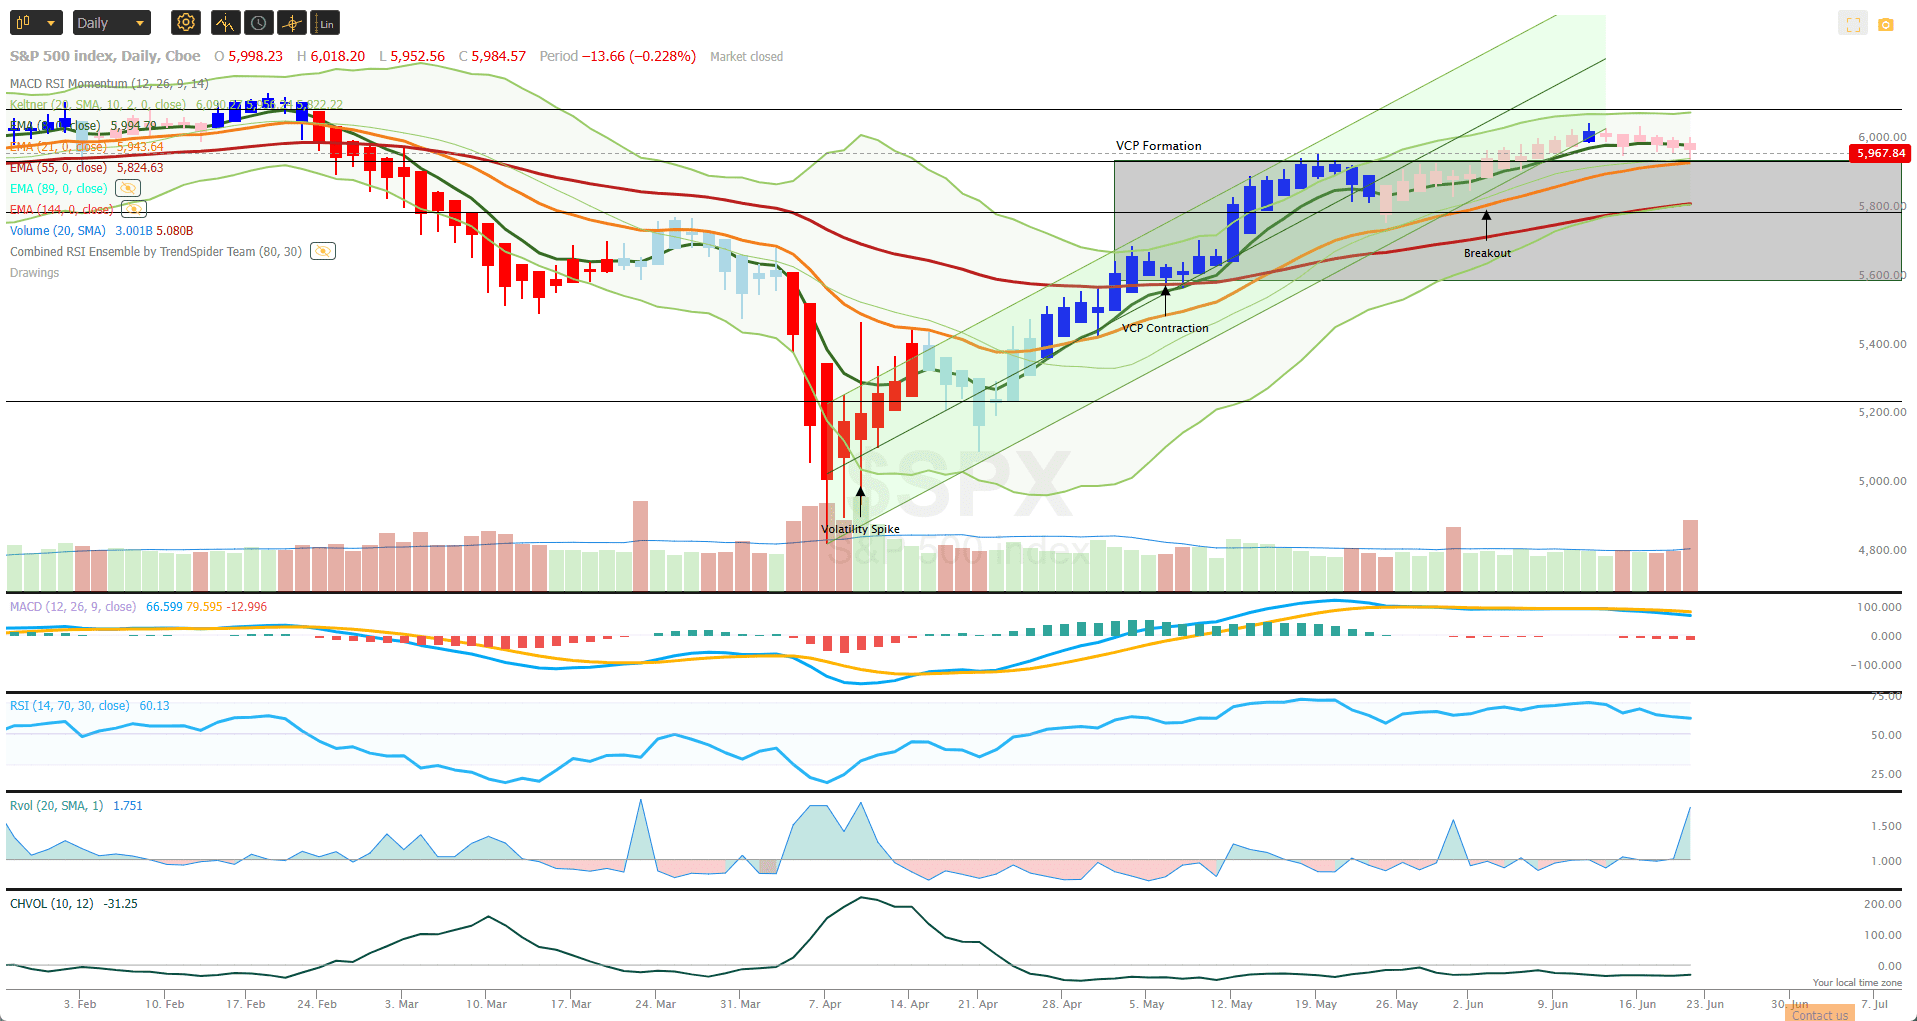
Maybe significant (we’ll have to wait until next week to see) there was above average volume selling on Friday – maybe as a result of investors getting nervous over tensions between Israel and Iran and the prospect of the USA providing support to Israel through the provision of B2 bombers.
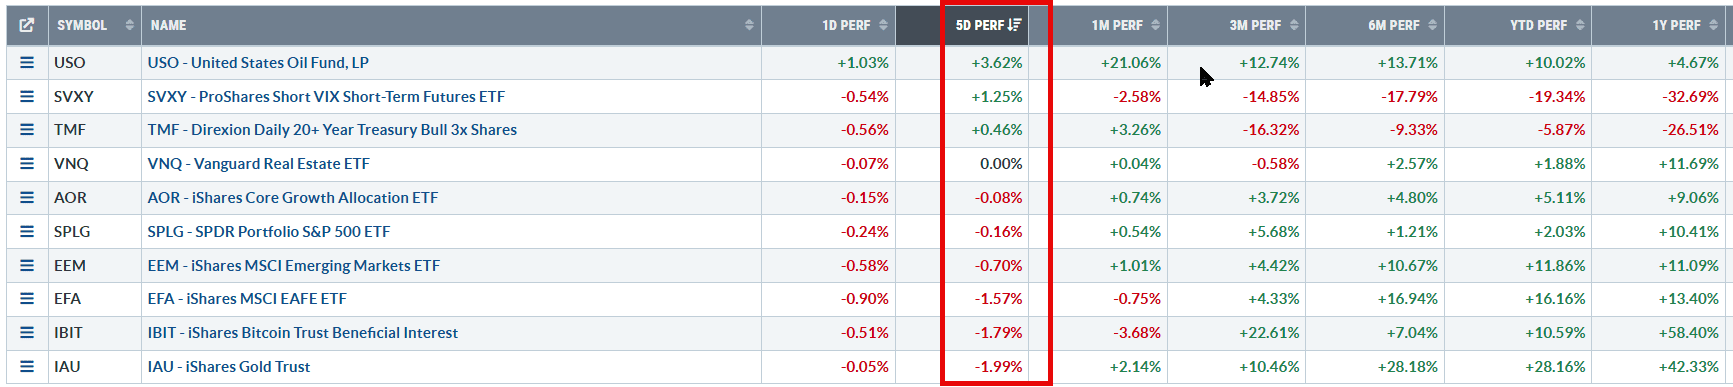
In terms of relative strength, compared to other major asset classes, US equities remain in the middle of the pack:
Darwin Core Portfolio Holdings:
On Friday, I received ~$530 in dividends from EEM and EFA that leads to the following activities in this Core Portfolio:
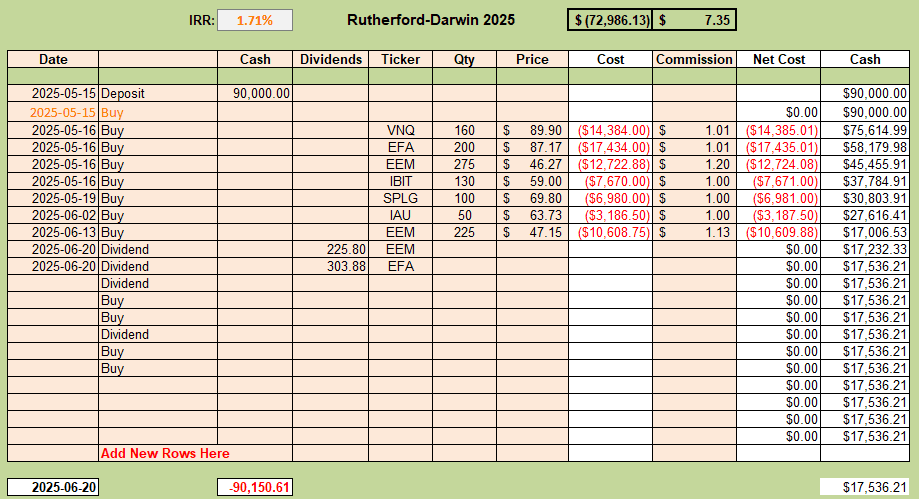 Considering the consolidation that has been going on in the 5 weeks that this portfolio has been held, the 1.7% IRR is not too disappointing.
Checking the Kipling worksheet for this week’s rankings and recommendations we see the following picture:
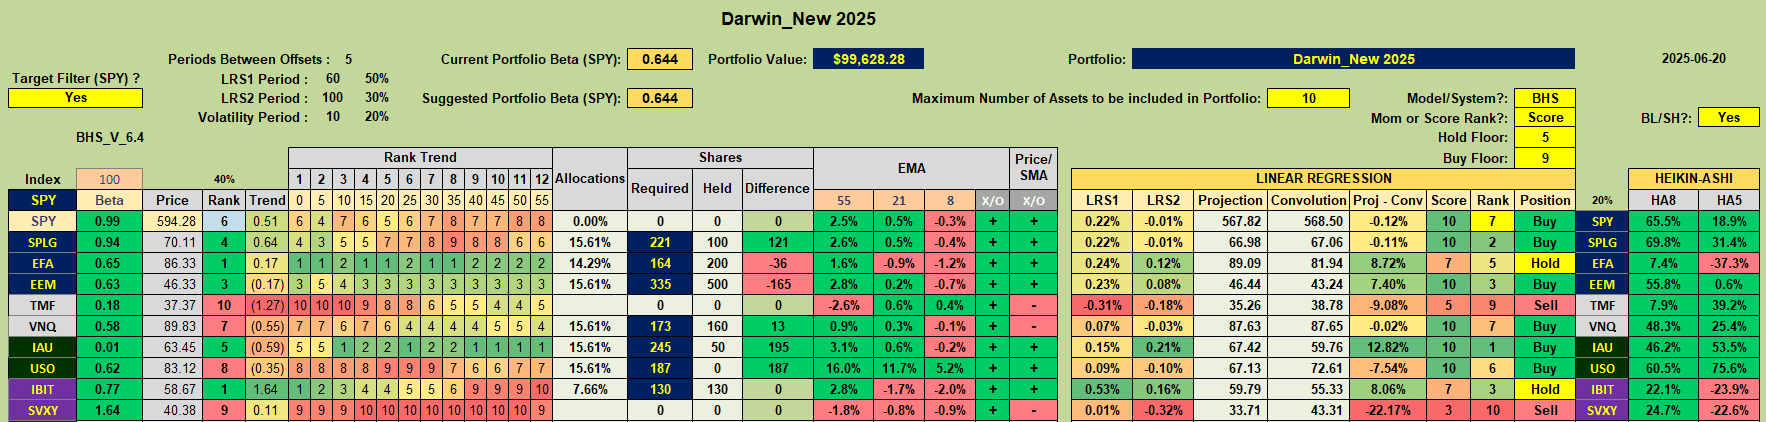 I spent a little time cleaning up/simplifying this workbook and made a couple of minor changes. The workbook is now focused on the BHS model with the select table options cut back to whether we want to filter for short-term momentum (BL/SH) and/or for strength compared to the target fund (highest correlation with current holdings) – in this case SPY (S&P 500). I have also changed the EMA period look-backs to 8, 21 and 55 to satisfy my obsession with Fibonacci and to match the values I use when looking at charts – e.g top graphic. At the moment the price of the target SPY fund is lying above all but the 8-period EMA with the EMAs stacked favorably above one another. The only potential warning signs come from the recent slight drop in price, with high volume on Friday, combined with a flattening of the EMA curve and a negative crossover in the MACD Indicator. Volatility remains low and the Relative Strength Indicator, although flattening, is still in bullish territory (>50) without being overbought (>75) – that are all good signals.
In the above screenshot we can see that I have tightened up the filters such that Buy recommendations require positive short-term momentum while outranking the target fund (SPY). Even with these tight restrictions we see that five Buy recommendations are flashing for SPLG, EEM, VNQ, IAU and USO with Hold recommendations for EFA and IBIT. It is nice to see that VNQ, that has been consolidating, with a recommended Sell signal for the past 2 weeks, has now switched to a Buy recommendation. This re-enforces the value of looking for confirmations elsewhere than in the Kipling workbook – but, of course, it’s all extra work.
Since 6 of the 7 ETFs with Buy or Hold recommendations are presently held in the portfolio we’ll take a look at the only one that isn’t currently held – USO (Oil – Commodity asset class):
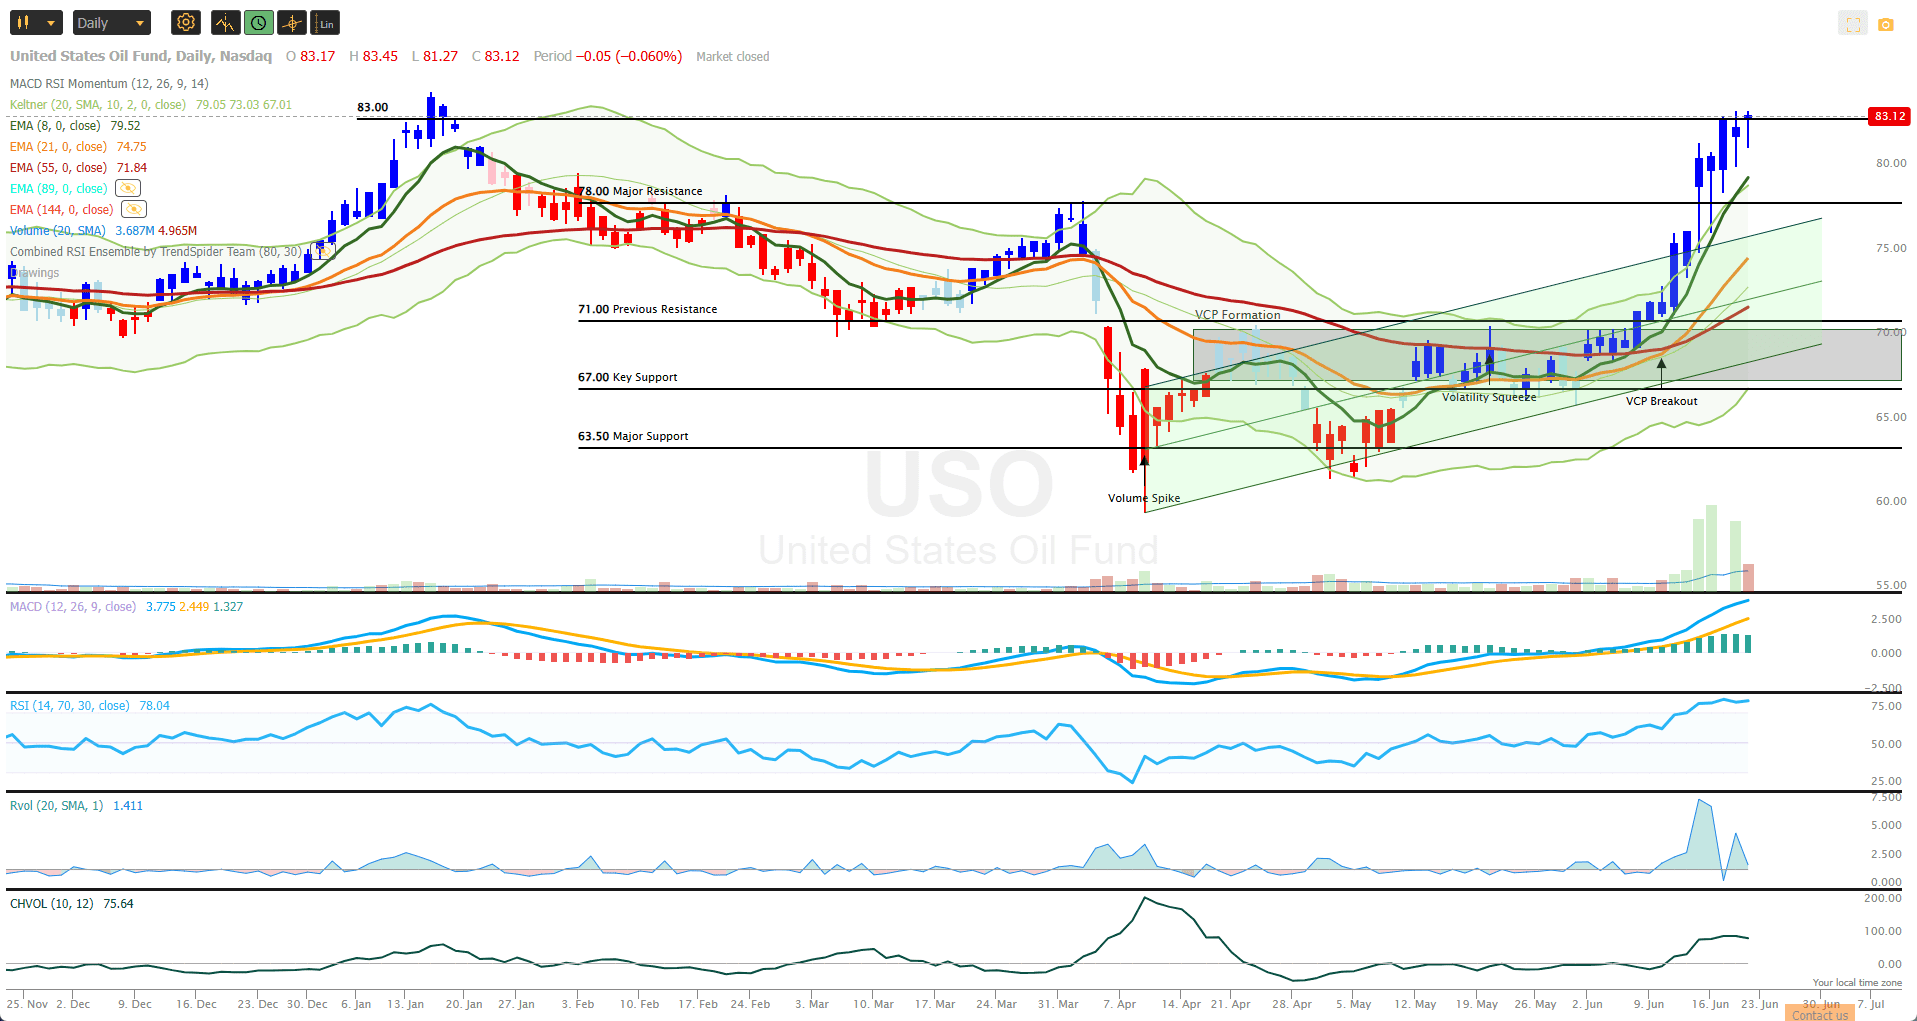 I have been watching this ETF for the past 2 weeks, since the Volatility Contraction Pattern (VCP) breakout ~10 June – but it was not showing as a Buy recommendation in the BHS worksheet until today. This is because the longer term trends were bearish – still only ranking eighth out of nine funds longer term but now generating a top Score of 10 with all measurements weighted. It is a difficult decision as to whether to enter here after such a strong short-term bullish move but we need to have confidence in our systems and stick with the Plan, so, if USO breaks above it’s current price and the January high of ~$83, I will go ahead and open a new position. The ultimate outcome will likely depend on the outcome of geopolitical tensions in the middle east.
At this point we’ll take a look at the allocation spreadsheet for this portfolio:
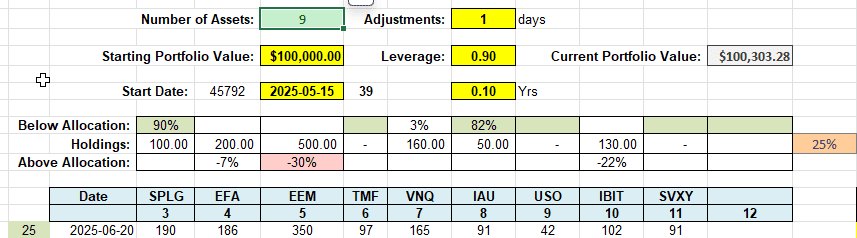 In earlier posts I mentioned that I wasn’t sure how often I would be making adjustments to this portfolio – and I still can’t say definitively, since it all depends on volatility in the markets, but, at this point, it seems appropriate to make some adjustments. SPLG is under-allocated and so it would seem appropriate to increase holdings in this ETF to 200 shares. IAU (Gold) is also under-allocated, so I will add 50 more shares of this ETF to bring total holdings to 100 shares – that will allow me to sell Options against the holdings if appropriate. Of course, I need to free up a little money and, although I added 225 shares of EEM to this portfolio last week I will sell 200 of those shares to bring me back to 300. This is not a bad deal since EEM went ex-dividend last Monday (16 June) and I picked up a $225 dividend as shown in the earlier screenshot. The only other adjustment will be to add shares of USO to the portfolio – I will leave this until last when I will know how I stand with the level of funds allocated to everything else – but I suspect that I may only be able to buy ~40-50 shares as calculated in the above table. I would like to hold 100 shares so that I could sell Options against the holdings – but that may not be appropriate unless I sell a few shares in IBIT and/or VNQ to compensate. I will update this post when the adjustments are made.
Rutherford Risk Management:
This was an interesting week with Options expiring for SPLG and VNQ on Friday. In addition, on Monday, I also sold Options in EEM and EFA to replace Options that expired last week. This brought in an additional $530 in credits to act as a hedge for the portfolio.
Here’s how the hedge positions were looking ~1 hour from the Close on Friday (I can’t generate these screenshots after the close since they require live data from the broker – and these are unavailable after the close):
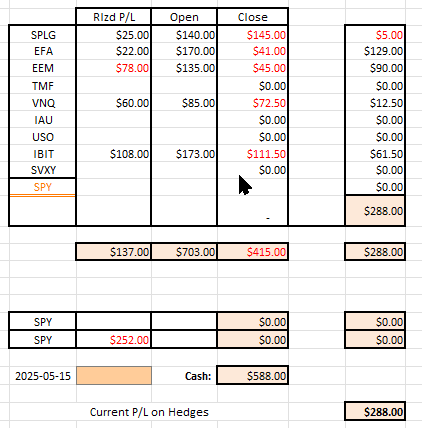 To date the portfolio is holding $137 in realized gains from the sale of call options that have either expired or been bought back and $703 in credits from the sale of Options that are currently held. If I were to Buy back these open Options today it would cost me $415 to do so – leaving me with a net credit of $288 from these positions plus the $137 realized profits for a total of $425.
Looking at the total portfolio, the position (in tabular format) looks like this:
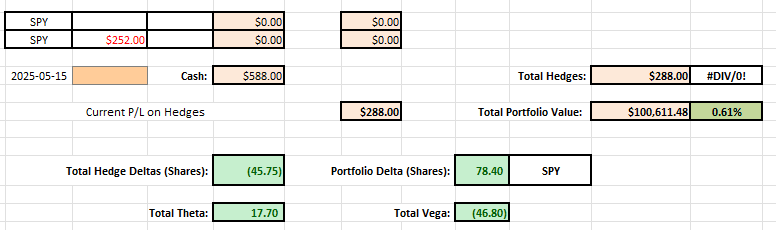 showing ~0.6% profit and collecting ~$18 per day in time premium decay from the sale of the Call Options.
The Call Options sold in the last week were:
- 2 x EFA 18 Jul 90 Calls at 0.85 – $170 Credit
- 5 x EEM 18 Jul 49 Calls at 0.27 – $135 Credit
- 1 x SPLG 18 Jul 70 Call at 1.40 – $140 Credit
- 1 x VNQ 18 Jul 91 Call at 0,85 – $85 Credit
Total Credits $530.
Apart from SPLG these all replaced Options that expired worthless (enabling me to keep the credits on the Options sold). Options on SPLG were In-The-Money (ITM) at the time of trading so I had to buy the expiring Options back (to avoid my shares being taken away) leaving me with only a $25 realized gain.
Graphically portfolio performance looks like this:
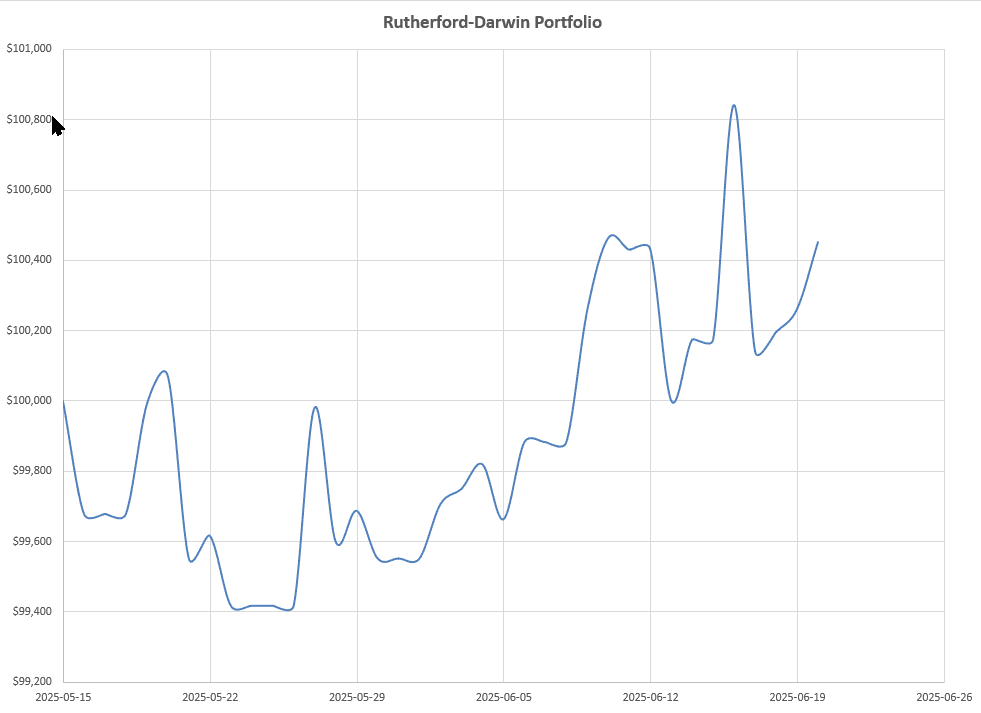
with volatility running at a low 4.17%.
Update 23 June 2025 12:00 pm EST:
The markets were pretty quiet this morning so I was able to make adjustments without any problems. As anticipated in the post, above, I sold 200 shares in EEM and I also sold 30 shares in IBIT that enabled me to Buy 100 shares of USO. I also added to existing positions by buying 100 shares in SPLG and 50 shares in IAU. At this point I have not sold any Call Options to generate more credits and won’t do so until I see evidence of weakness, The dynamic picture of the portfolio at 12 noon EST now looks like this:
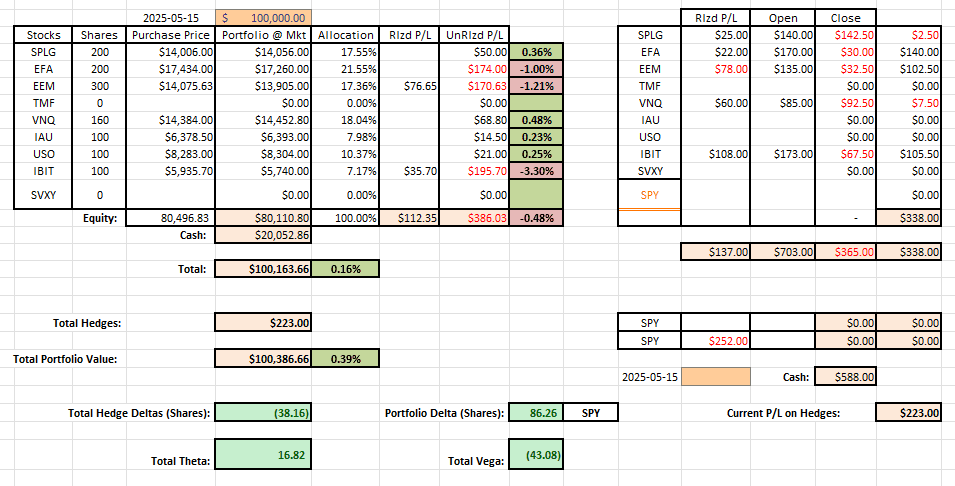 with ~$80,000 invested and where we see $112 in realized profits from the sales of shares in EEM and IBIT. This, together with the current holdings in the Core Darwin portion of the portfolio can be seen in the top left table of the above screenshot.
This portion of the portfolio is up a modest 0.16% with credits from the Option hedges adding another $223 profit for a total portfolio return of 0.39% over the 5 weeks since inception of the portfolio on 15 May.
Discover more from ITA Wealth Management
Subscribe to get the latest posts sent to your email.
The above post has been updated to reflect the adjustments made to the portfolio this morning.
That was terrible timing on the USO purchase – price has since dropped 7%! However, that’s the system, so we’ll wait to see if there’s a recovery. In the meantime I’ve Sold a Call Option, at the $83 strike price (resistance level) expiring 2 July for 1.02, or $102 credit to at least partially offset the losses.