
Street Photography
Einstein is the portfolio scheduled for review this morning. The Kepler and Einstein are the two remaining Relative Strength or Relative Momentum portfolios requiring an understanding of how the Kipling spreadsheet works. This analysis will take readers through the major steps.
Einstein Investment Quiver
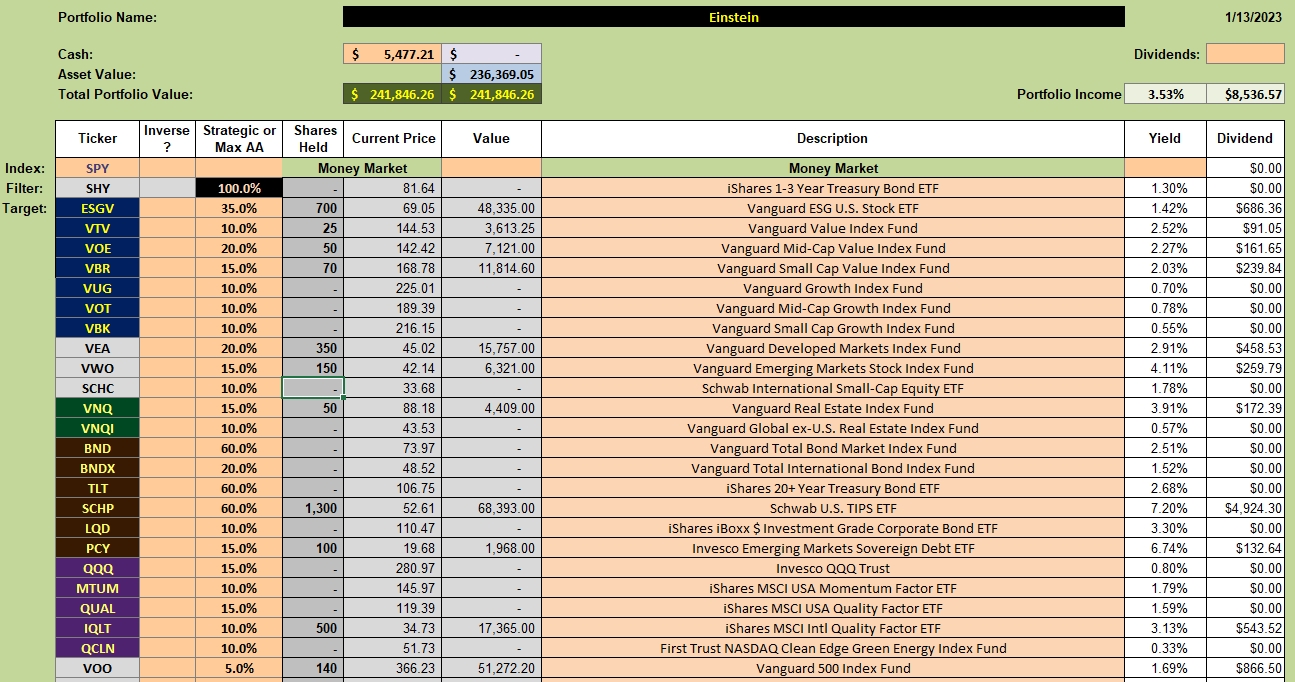
We begin the Einstein analysis with the investment quiver. This portfolio is constructed along the lines of asset allocation and the Fama-French Five-Factor Model. Two asset classes not included are Precious Metals and Commodities. Precious Metals does not have a strong long-term historical and Commodities requires extra pains when filling out U.S. Federal Tax Forms. Those are my primary reasons for shedding those two asset classes from ITA portfolios.
The Einstein currently holds eleven different ETFs. Over time I’ll trim this portfolio down to five ETFs.
Einstein Security Recommendations
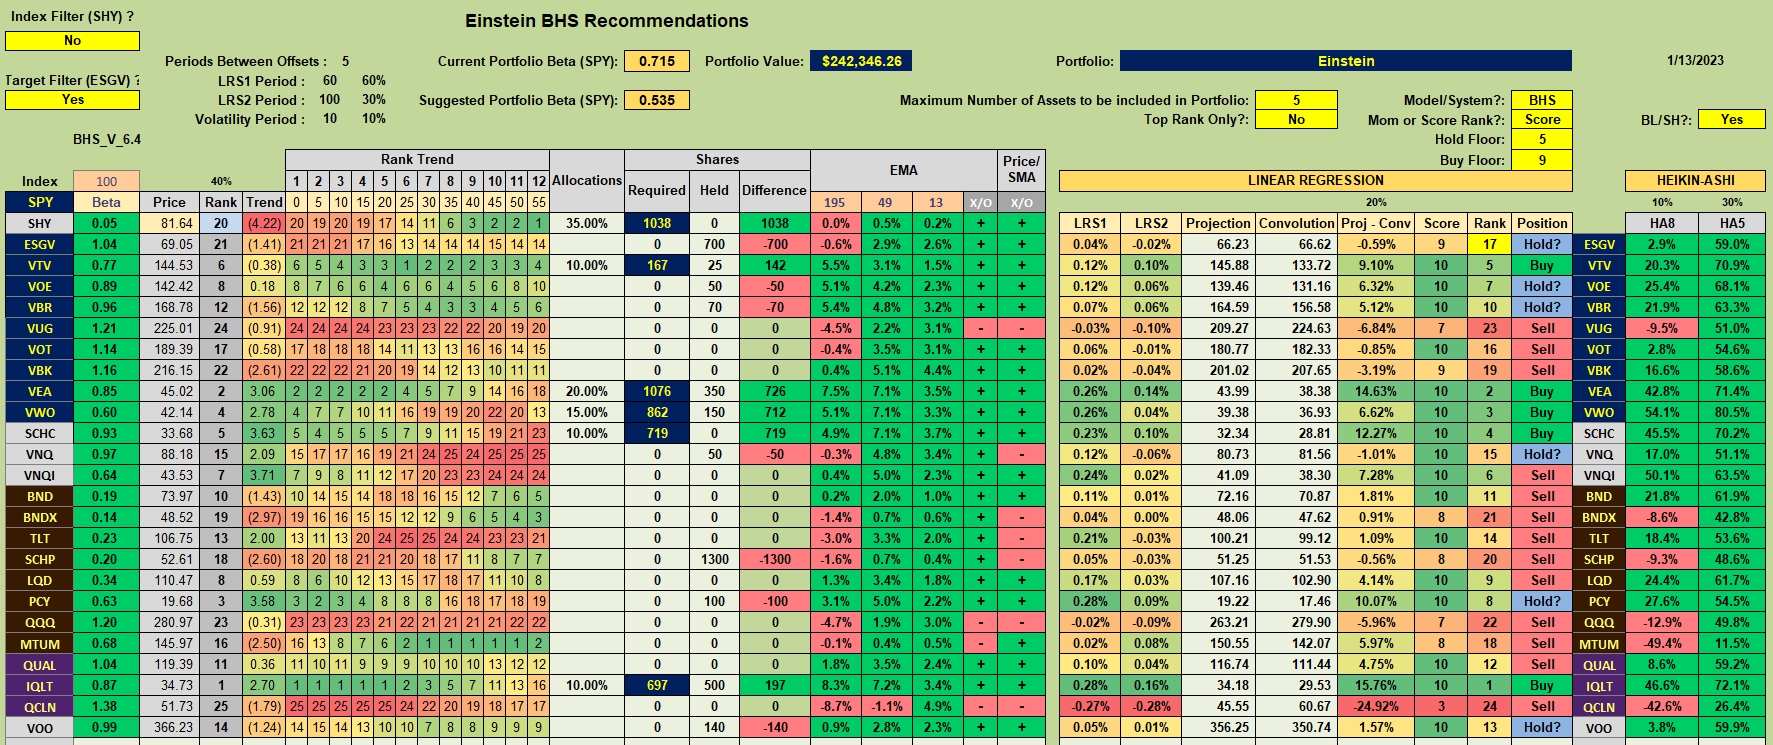
Using the BHS model and the Target Filter for ESGV turned on, we have five Buy recommendations and numerous Hold? designations. When you see a Hold? it is up to the money manager whether or not to continue to hang on to the security. In my case I’ve set tight (3% and 4%) Trailing Stop Loss Orders (TSLOs) for the ETFs with a Hold? designation.
Einstein Manual Risk Adjustments
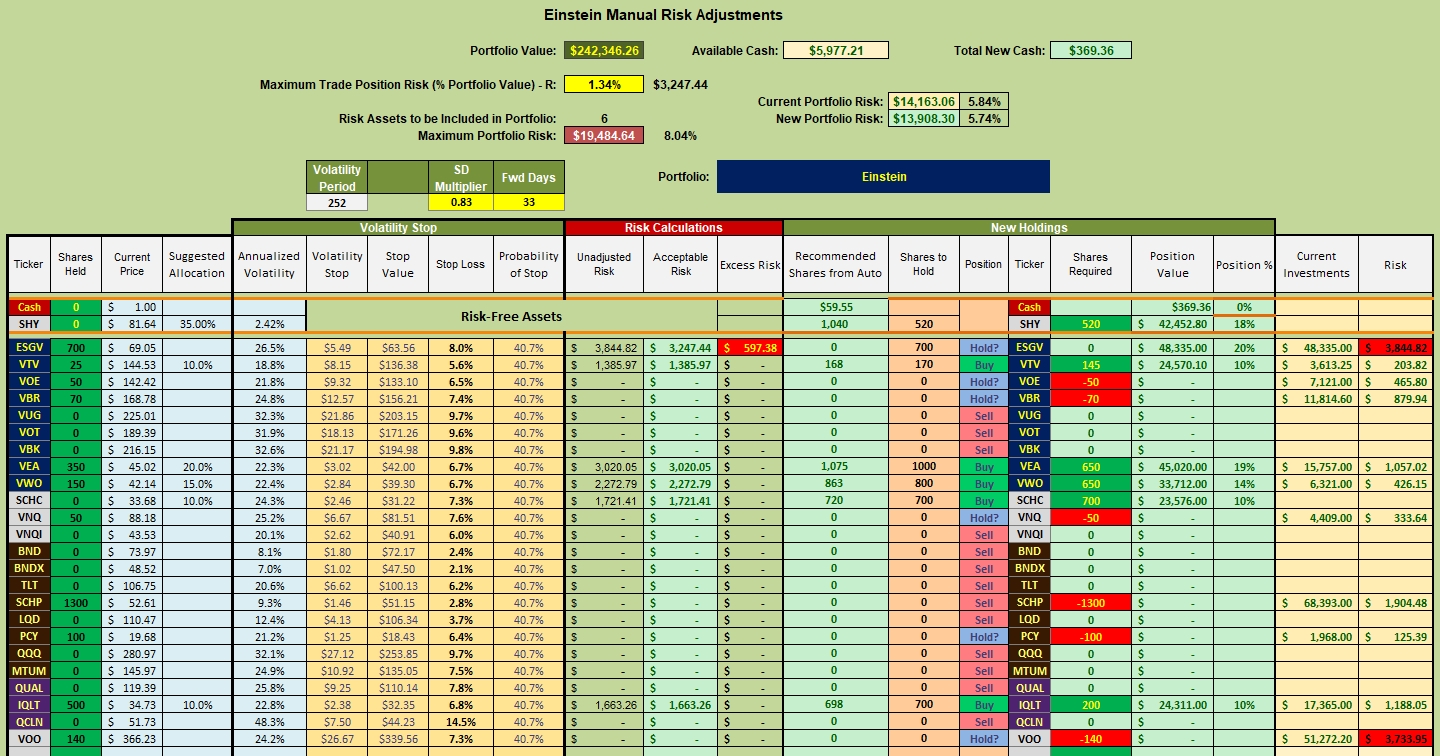
With the SD Multiplier set to 0.83 the Stop Loss percentage for ESGV is 8.0%. In general, I want the Stop Loss value to come in around 8 or 9 percent for the broad market and ESGV represents that broad market. As I’ve mentioned before, readers retired or close to retirement are interested in capital preservation and that preservation is being threatened by members of congress who are likely to hold the debt ceiling hostage. Young investors need not pay much attention to this activity as they have a longer investment horizon and we know the debt limit will eventually be raised. To the young investor, continue to save and dollar cost average.
If you check the specific ETFs below you will notice that International Equities are recommended, in general, over U.S. Equities.
Einstein Performance Data
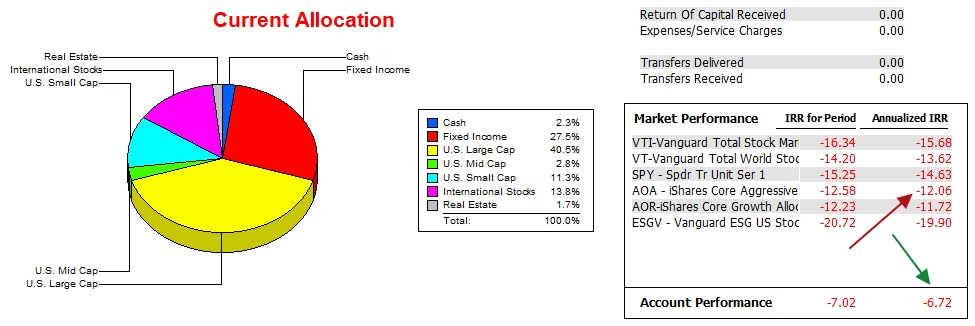
How has the Einstein performed over the past year? The following data runs from 12/31/2021 through mid-morning of 1/17/2023. Yes, the Einstein is still in the red, but it has crushed both the AOA benchmark and the S&P 500 as represented by SPY.
Einstein Risk Ratios
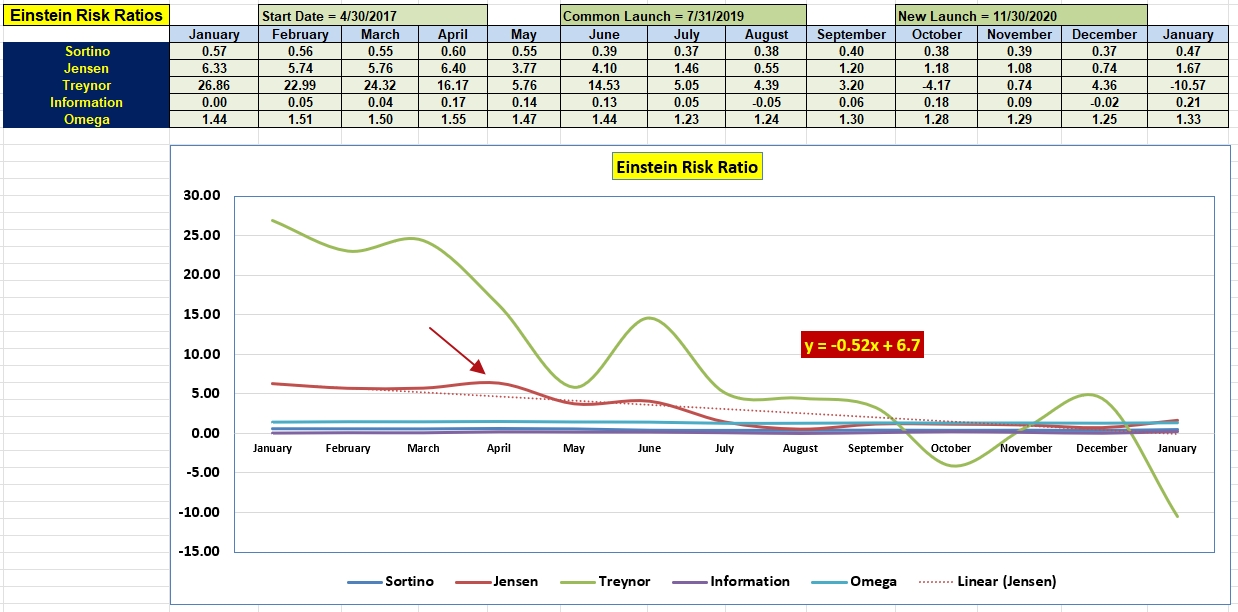
The following table and graphs focus on the risks involving the Einstein. The single standout value is the Information Ratio. This number shows the performance of the portfolio vs. its benchmark. Any value above zero is to be high commended.
Of the five risk measurements, I consider the Jensen to be the most important – by far. While 1.67 is much lower than it was last year (6.33), the end of 2021 and beginning of 2022 were strong periods. It was the decline in 2022 that played havoc with most portfolios. An increase in January over December is most welcome.
Discover more from ITA Wealth Management
Subscribe to get the latest posts sent to your email.
You must be logged in to post a comment.