
Autumn Leaves
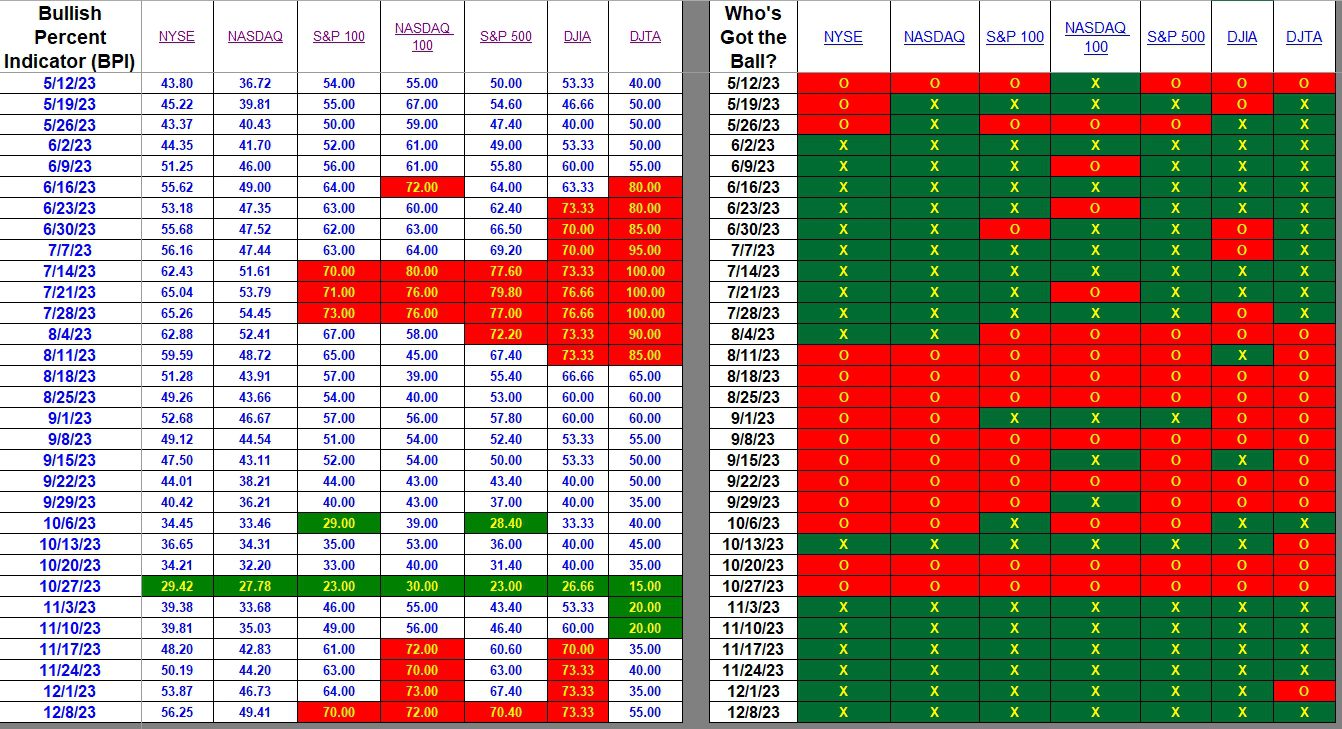
Based on Bullish Percent Indicator (BPI) data this past week was a modest success. All major indexes that cover U.S. Equities are currently positive and all sectors with one exception either held even or moved up the bullish scale. Two sectors are moving closer to the overbought zone which is 70% or higher on the bullish scale.
Index BPI
The tale told in the following BPI data is that we are in the midst of a large-cap market. Compare the bullish percentages for the S&P 100 and S&P 500 with the two larger indexes, NYSE and NASDAQ. These latter two indexes contain more small- and mid-cap stocks. When the NASDAQ is hovering around the 50% bullish level and the NASDAQ 100 is 22 percentage points higher, we know the smaller cap stocks are not pulling their weight in this market. We are not in a broad bull market.
Sector BPI
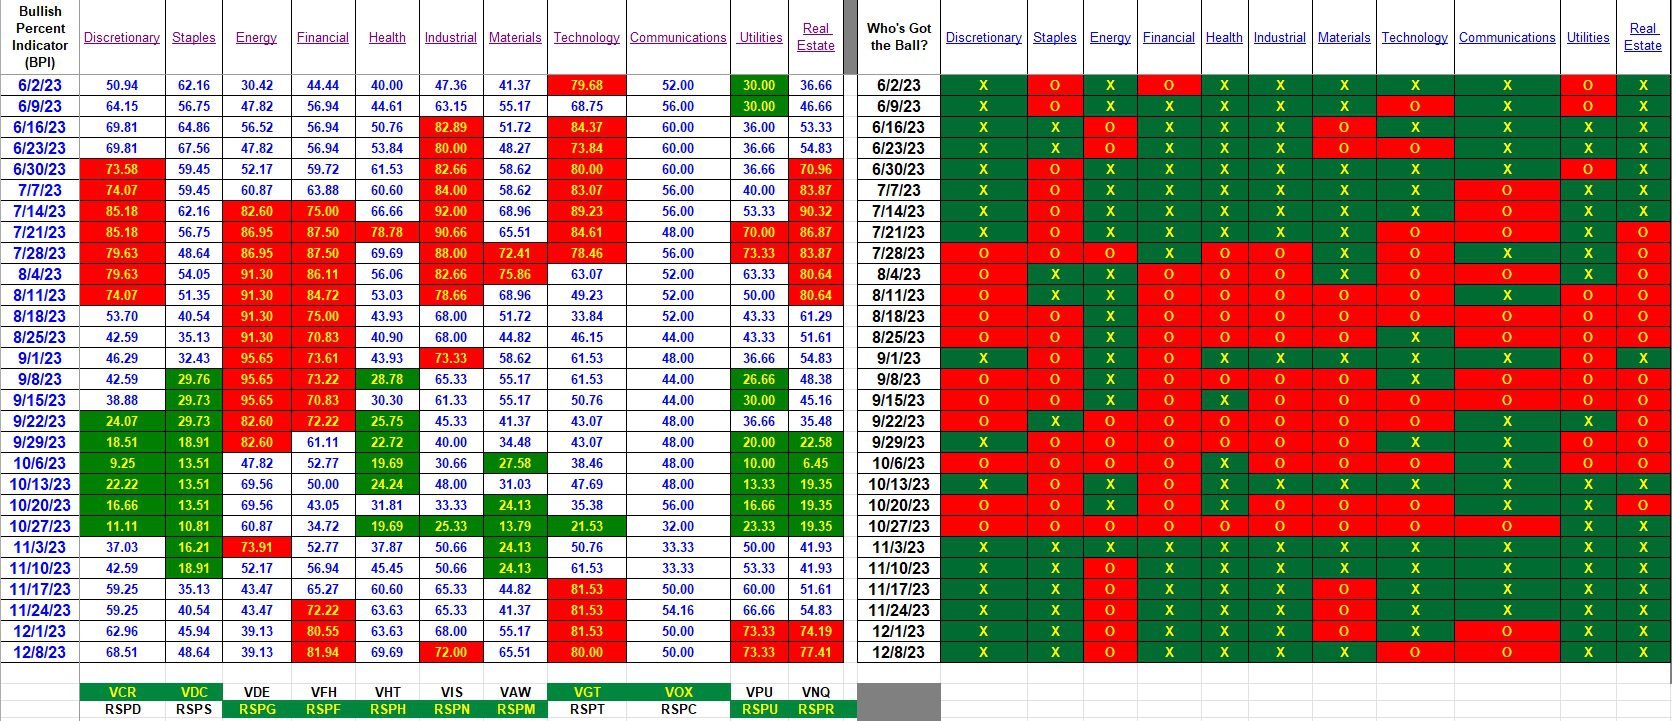
Discretionary and Health are closing in on the overbought zone or about to join Financial, Industrial, Technology, Utilities, and Real Estate as overbought. The last major buying opportunity showed up on 10/27/2023 and all the portfolios set up to use the Sector BPI model benefited from a strong market since last October.
By this time next year we will likely go through one or two Buy/Sell cycles and this will provide more data as to the viability of this investing model. Thus far it looks quite positive. The Sector BPI investing model is not one that can easily be back-tested and that is why the week to week performances for the different portfolios is so important. Each month that passes builds or disproves the case for the Sector BPI investment model.
Explaining the Hypothesis of the Sector BPI Model
Carson Portfolio Update: 18 November 2022
Discover more from ITA Wealth Management
Subscribe to get the latest posts sent to your email.
TSLOs were set for Health (VHT) as this sector moved into the overbought zone today.
Lowell