
Union Pacific Railroad passing under Fremont Bridge in Portland
Bohr is the portfolio scheduled for review this morning. This is a combination growth-income style portfolio where the income is primarily generated by Closed-End-Funds, much as you find in the Hawking and Huygens portfolios. The first move when updating the Bohr, is to go to CEF Connect and check to see if the CEFs are generating the “required” 8% or greater yield and are priced below their Net Asset Value (NAV). When I checked yesterday only EOD is currently priced above its NAV and EOD is throwing off a yield in excess of 11%. Therefore, I’ll not touch EOD, but do not plan to purchase more shares of EOD with available cash.
Bohr Investment Quiver
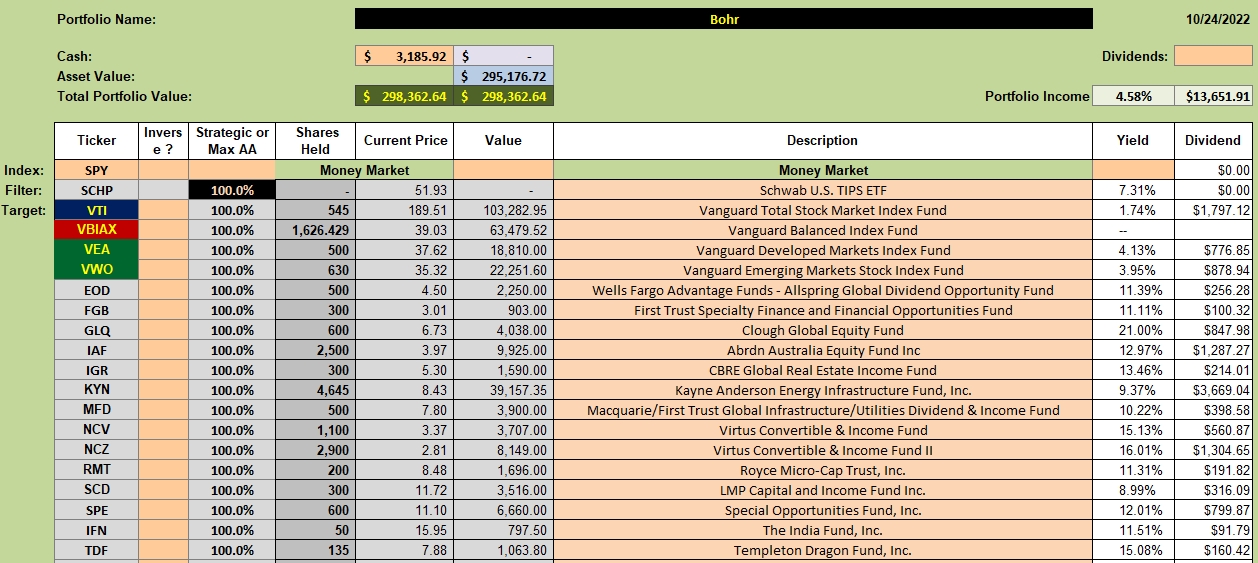
Below is the current investment quiver for the Bohr and the number of shares held in the different securities. The yield of 4.58% should be higher but for VBIAX not reporting dividend yield. For investors needing some income for living expenses, check the Hawking, Bohr, Huygens, and Bethe portfolios. These four portfolios generate higher than normal incomes.
I recently added more shares of GLQ and IFN using dividends from the third quarter.
Bohr Security Recommendations
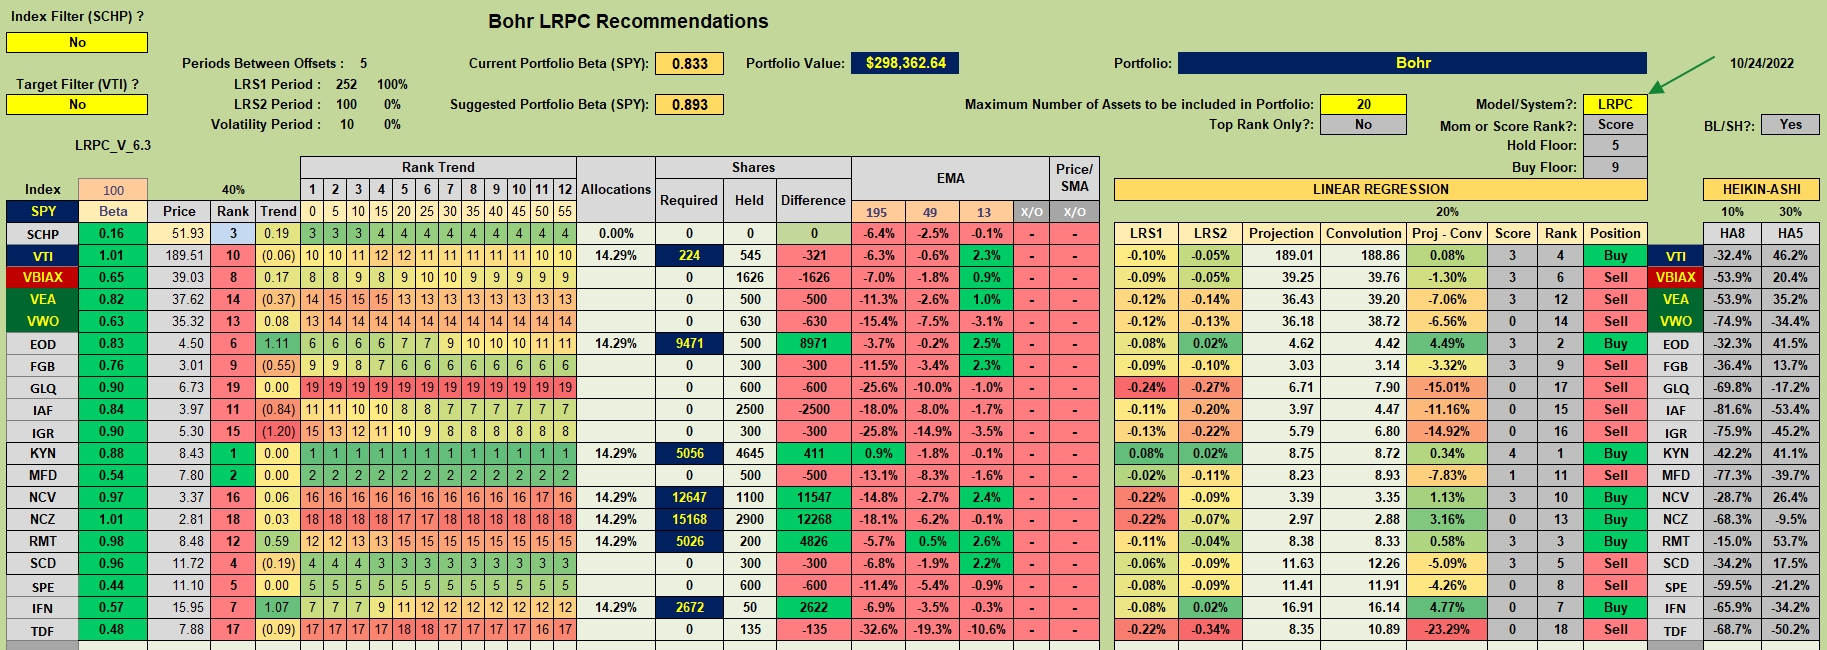
If using the LRPC investing model, several Buy recommendations show up. I don’t pay too much attention to the following worksheet for the Bohr as this portfolio is essentially a Buy & Hold portfolio.
I do plan to sell all shares of VBIAX and replace it with the bond ETF, BND.
One option investors might consider is to set the Model/System to BHS and then apply the recommendations only to VTI, BND, VEA, and VWO while leaving the CEFs alone, assuming they are generating the require yield and are priced below their NAV. I plan to move to something very similar to this approach for both the Bohr and Bethe portfolio in November.
Bohr Performance Data
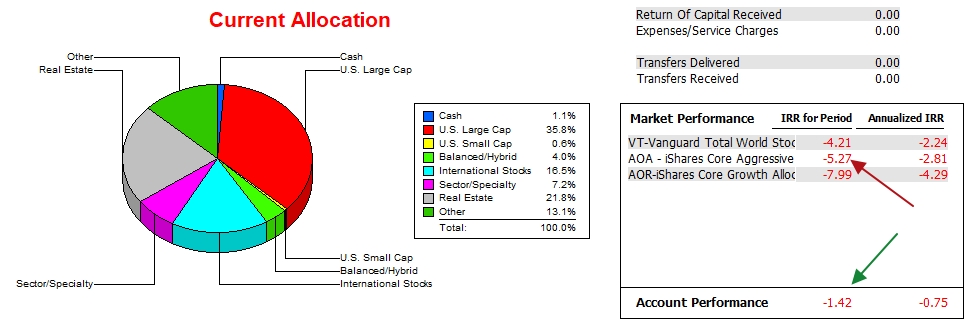
Since 11/30/2020 the Bohr IRR for the nearly two year period is negative 1.42% (-1.42%) while each of the three possible benchmarks are considerably lower.
When I ran a recent check on portfolio performance, the income portfolios are performing best when compared to the Robo Advisor portfolio, the Schrodinger.
Bohr Risk Ratios
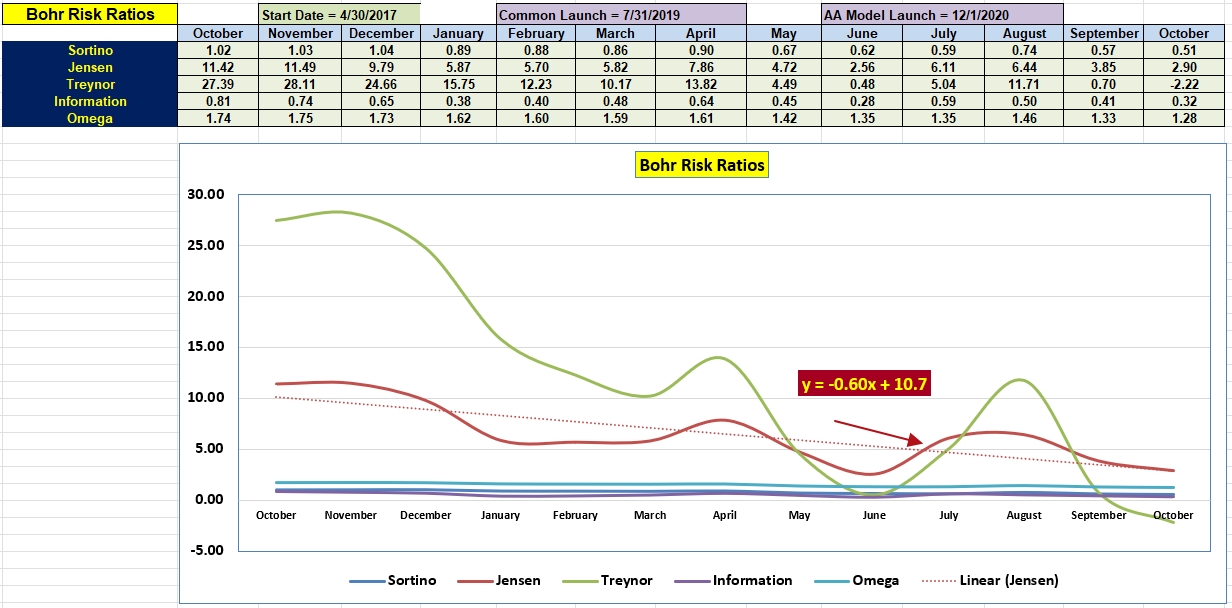
The negative slope of the Jensen tells a rather clear picture for the 2022 market. Until inflation is under control and many of the supply lines are restored, we can expect a volatile market. This is where these income oriented portfolios play a significant role in the overall diversification. While stock growth is uncertain we can count on dividends to continue to roll into portfolios such as the Huygens, Hawking, Bohr, and Bethe.
Portfolio Management In A Volatile and Bearish Market
Discover more from ITA Wealth Management
Subscribe to get the latest posts sent to your email.
Lowell,
Sorry for the beginner questions…..Where would I find the following for a portfolio: how much higher or lower the monthly asset totals are? Monthly total of additional dividends?
TF,
There is no one place to find the data you are asking for. However, the value of each portfolio is available. If you go to the right-hand side bar and look for Categories, use that pull down menu to find the portfolio of interest. When using Categories, it will bring up the old posts first. You will find the value of the portfolio at that particular review period in the first or second screenshots.
Most of the portfolios peaked at the end of 2021. This is not always true as some portfolio owners will withdraw money from time to time to cover their expenses.
As for dividends, those are best found within screenshots labeled Investment Quiver.
Hope this comes close to answering your questions.
Lowell
PS Since portfolios will vary if there are withdrawals it important to use IRR calculations.