
Einstein is the portfolio up for review this morning. The Einstein is one of two remaining Relative Strength or Relative Momentum portfolios using this investment approach. The other is the Kepler. As readers will see in a moment, these two portfolios use the full power of the Kipling spreadsheet and as a result are a little more complex or require more interpretation or decision making than portfolios such as the Copernicus or Schrodinger.
Einstein Investment Quiver
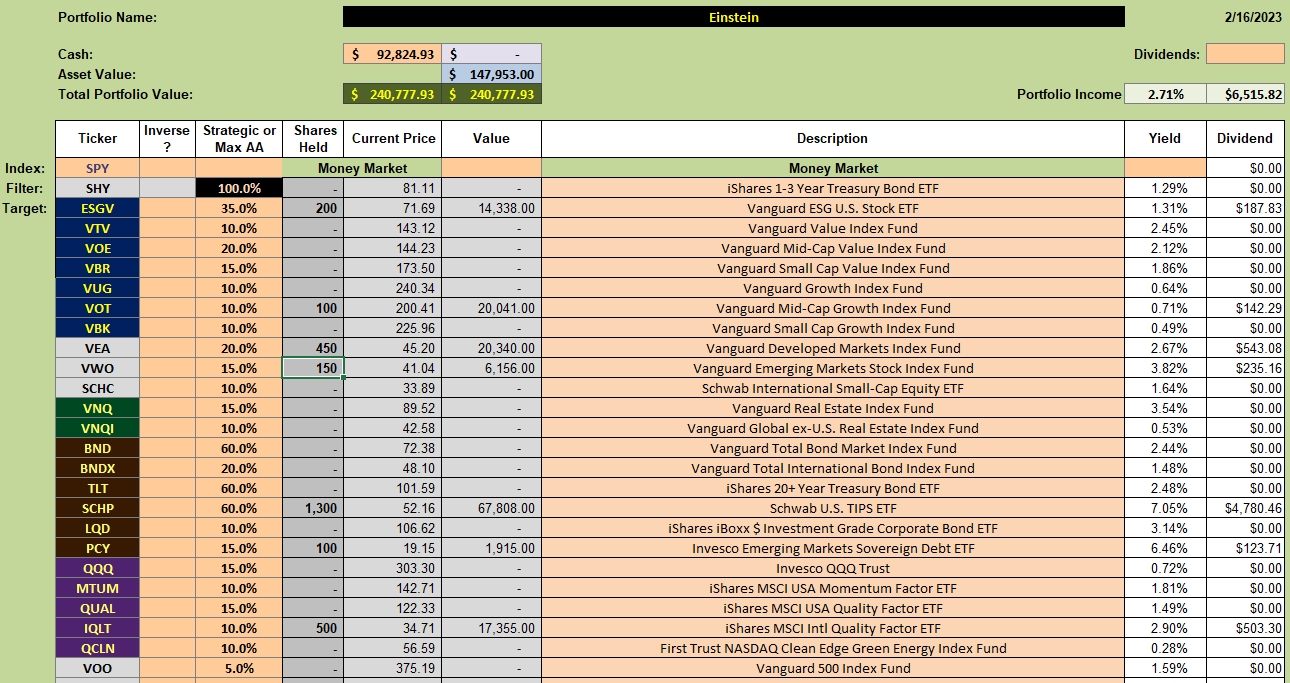
Below is the investment quiver for the Einstein and the current holdings. With these holdings, the yield is a respectable 2.7% considering the high percentage still held in cash. How to use the available cash is a major part of this review.
The investment quiver includes nearly all the basic asset classes as well as factors defined by the Fama-French Five-Factor model.
Einstein Security Recommendations
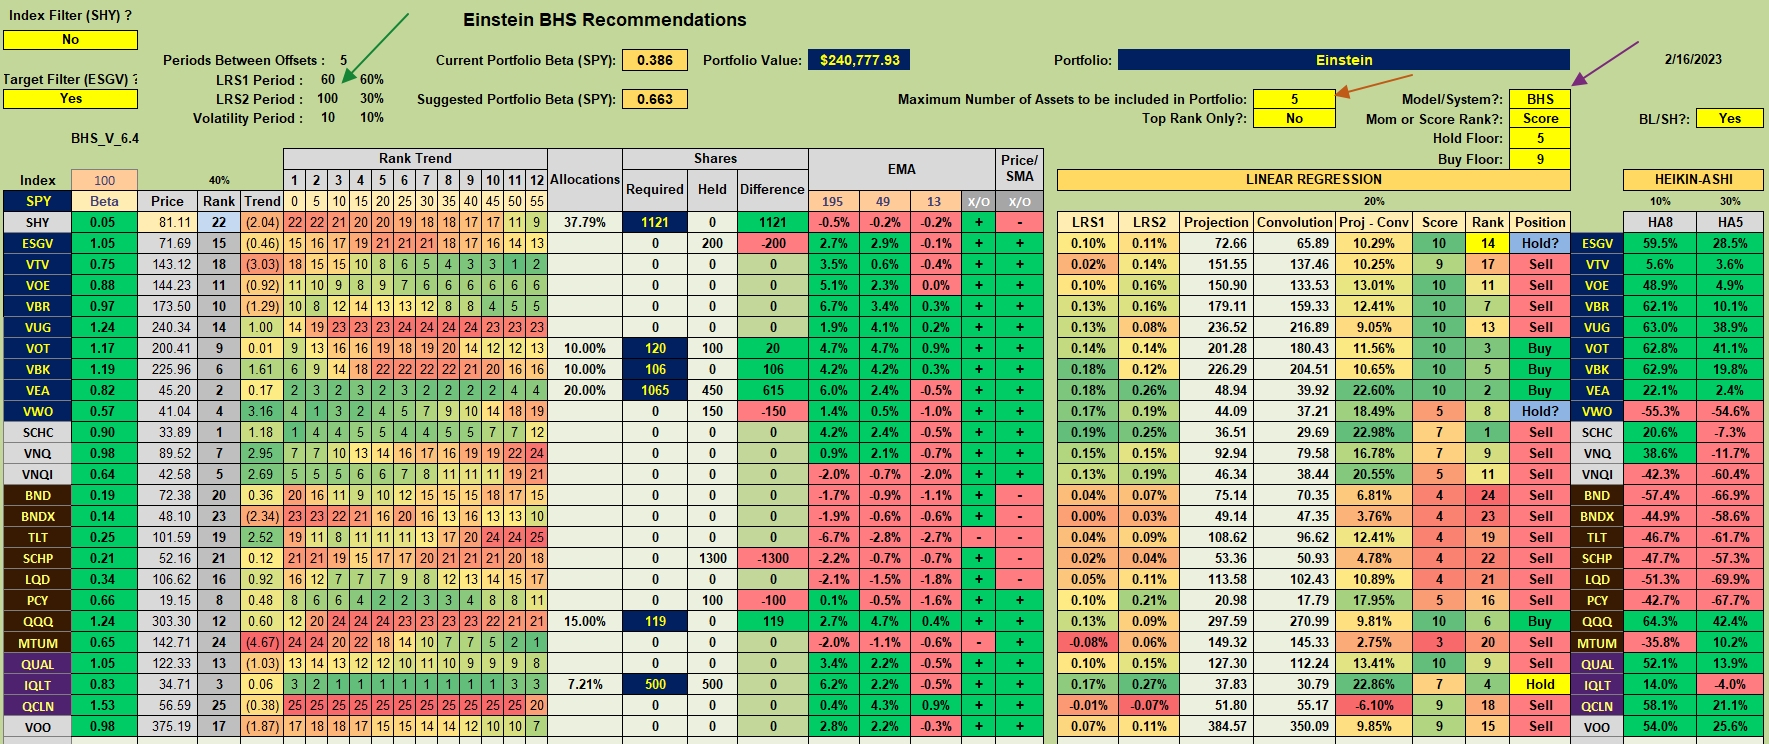
The following worksheet shows the Einstein to be using the Buy-Hold-Sell model (purple arrow) and the ESGV Target Filter is set to Yes. When this filter is turned on, we are seeking securities or ETFs that are outperforming the ESGV ETF.
The look-back combination (green arrow) is the default setting from the Kipling. Another variable is the Maximum Number of Assets to be held and the maximum number is five (red arrow).
With a beta of 0.386 this is a very conservative portfolio. The low beta is due to the high percentage currently held in cash. The Suggested Portfolio Beta is 0.663.
Einstein Manual Risk Adjustments
In the following worksheet I set the SD Multiplier to 0.85 so the Stop Loss for ESGV comes in at 8.0%. This is also a conservative setting.
The green arrow points to the suggested number of shares for the recommended securities. These shares are determined by the portfolio manager.
What I’ve done is to set limit orders to sell shares of SCHP and PCY. With the available cash I have numerous limit orders are in place to purchase shares of VOT, VBK, VEA, and QQQ. Only when shares of SCHP and PCY are sold will there be cash available to move to SHY.

Einstein Performance Data
How has the Einstein performed over the past 13.5 months? Using the Investment Account Manager software, the Einstein is essentially matching its benchmark (AOA). What is a tad surprising is that this portfolio is edging out the S&P 500 (SPY) and Vanguard’s Total Stock Market ETF, VTI.
Cash is a benefit in days when the market declines. In several cases I’ve set limit orders 10% and 15% below the current price as there is a high probability the market will decline due to the uncertainty over the debt limit issue. Yes, the national debt is a problem and needs attention. I may write a blog as to how I see this problem can be solved.

Einstein Risk Ratios
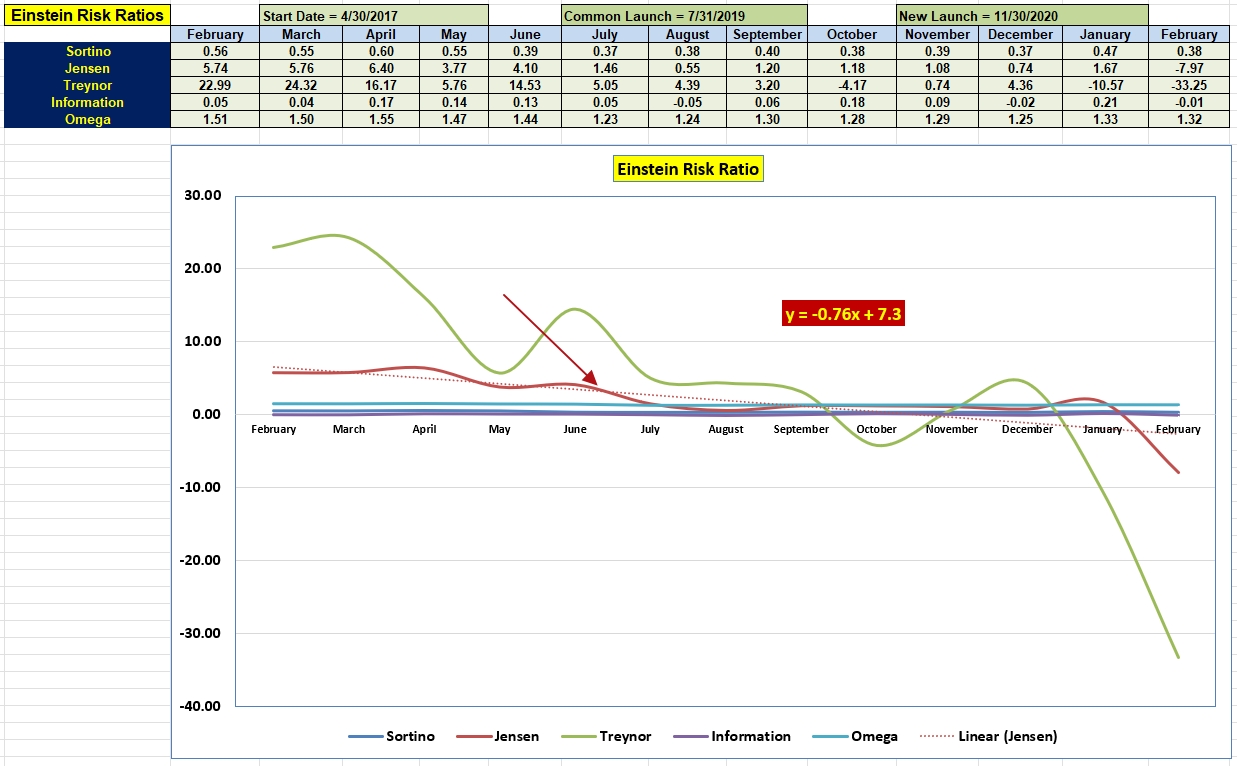
Where is the Einstein when it comes to Risk? Not so hot. Note the decline in the Jensen Performance Index since January and particularly from the spring of last year. The negative slope (-0.76) tells the Jensen Alpha story. I want to see a positive slope once we have cleared the negative 2022 data.
The Information Ratio bounced around the zero mark for most of the last year. In one sense we can conclude that is not too bad considering what we went through in 2022. The IR indicates the Einstein continues to hang close to its benchmark.
If the market declines further, the many limit orders will be struck. Should the market move higher, the Einstein will be left holding a lot of cash. I’m betting we will see a lower stock and bond market before the U.S. runs out of money in July.
Einstein Interim Update: 5 February 2022
Discover more from ITA Wealth Management
Subscribe to get the latest posts sent to your email.
You must be logged in to post a comment.