
Arches National Park – Utah.
Pauling is the Sector BPI portfolio up for review this morning. No sectors are to be found in the oversold zone so we expect little action in this update. In the last screenshot I included a table I rarely post so examine it carefully.
Tomorrow I plan to post the latest Bullish Percent Indicator data. If this information is not posted know we are in the middle of an ice storm and have lost electrical energy.
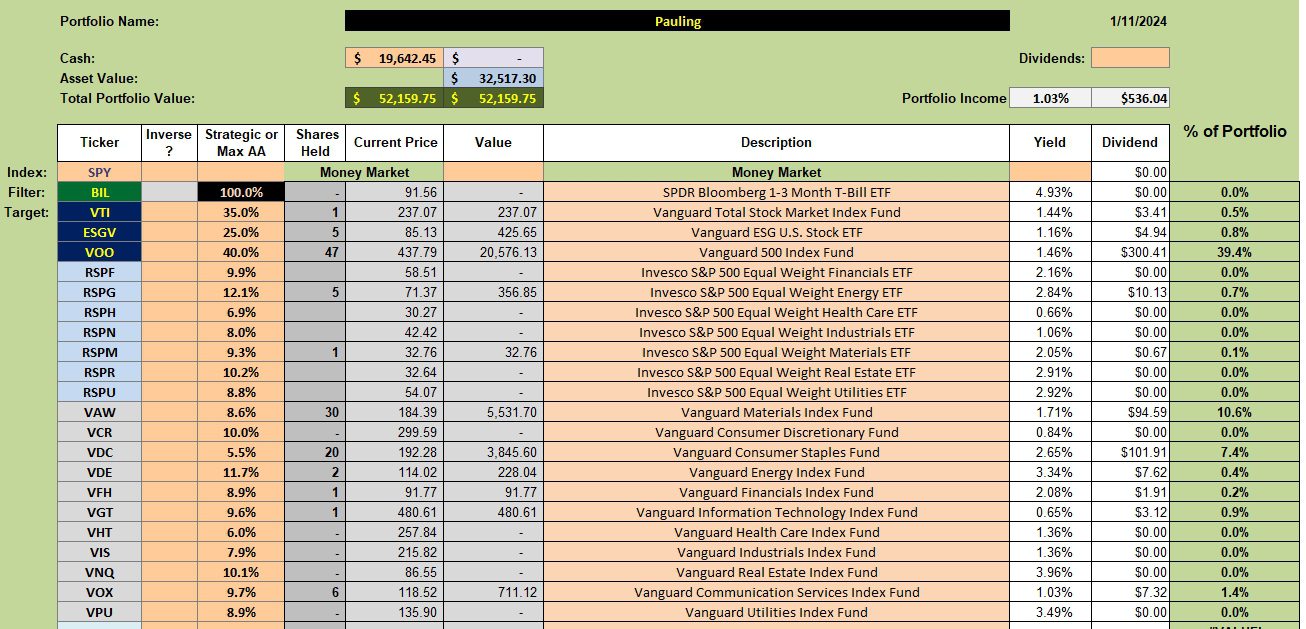
Pauling Security Holdings
As with most of the other Sector BPI portfolios the Pauling holds few sector ETFs. The majority of the portfolio is held in VOO.
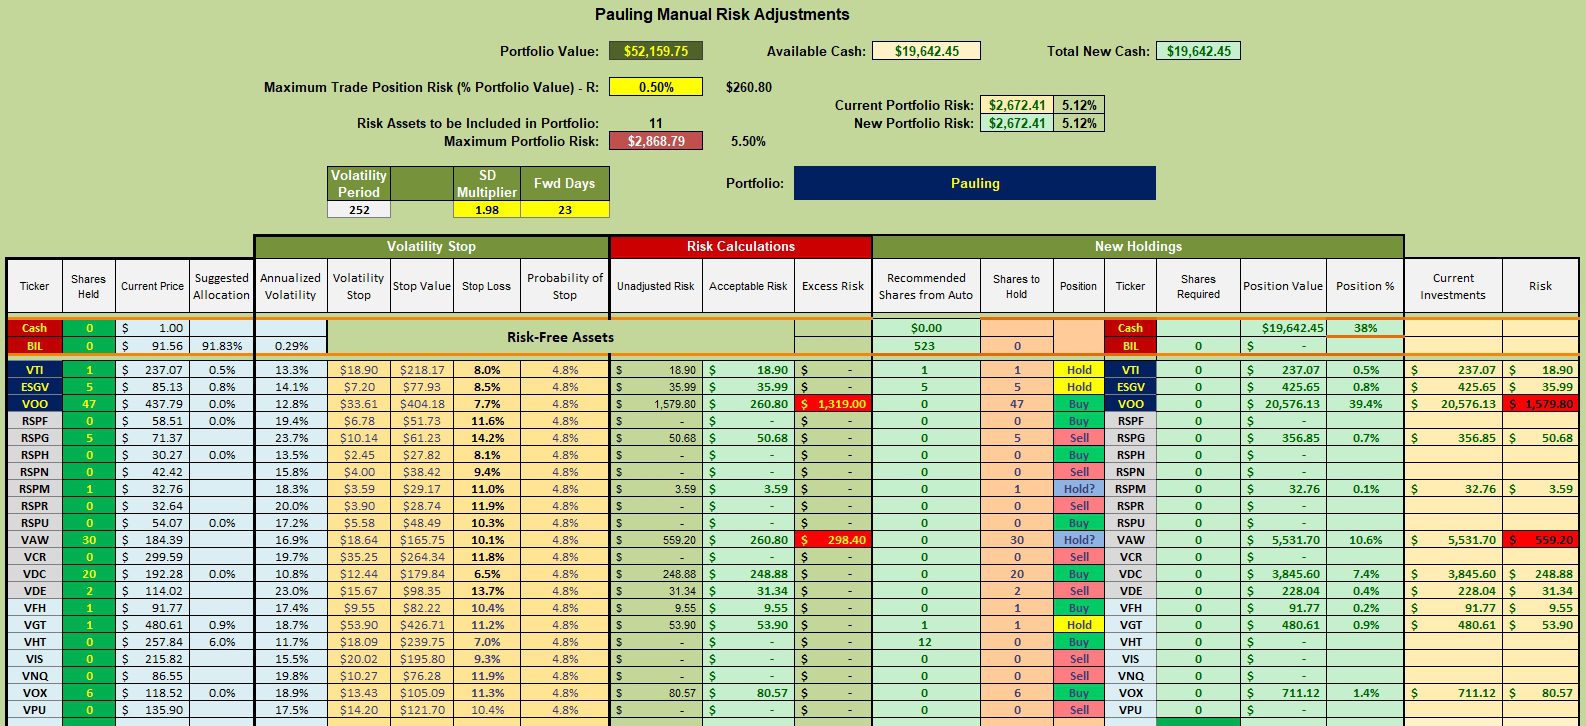
Pauling Manual Risk Adjustments
The manual risk adjustments call for no action. This does not mean I’m not doing anything with the $19,600 in cash. I have limit orders in place to pick up more shares of VTI, VOO, and ESGV. However, the limit orders are set at prices so low I don’t anticipate many purchases will occur before the next review.
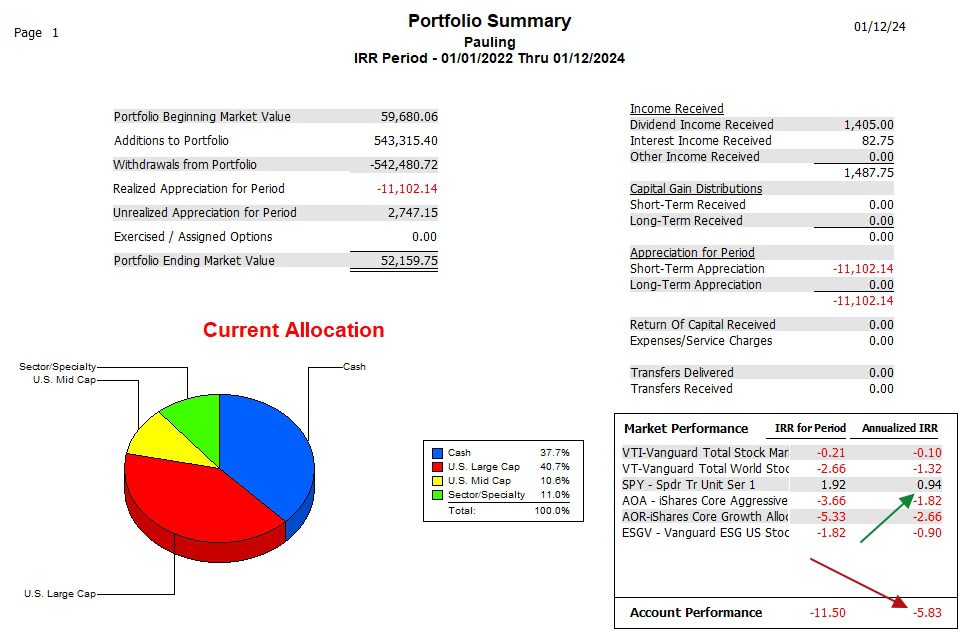
Pauling Performance Data
Over the past two years the Pauling continues to trail the SPY benchmark. This lack of performance is one reason for moving the Pauling over to the Sector BPI model.
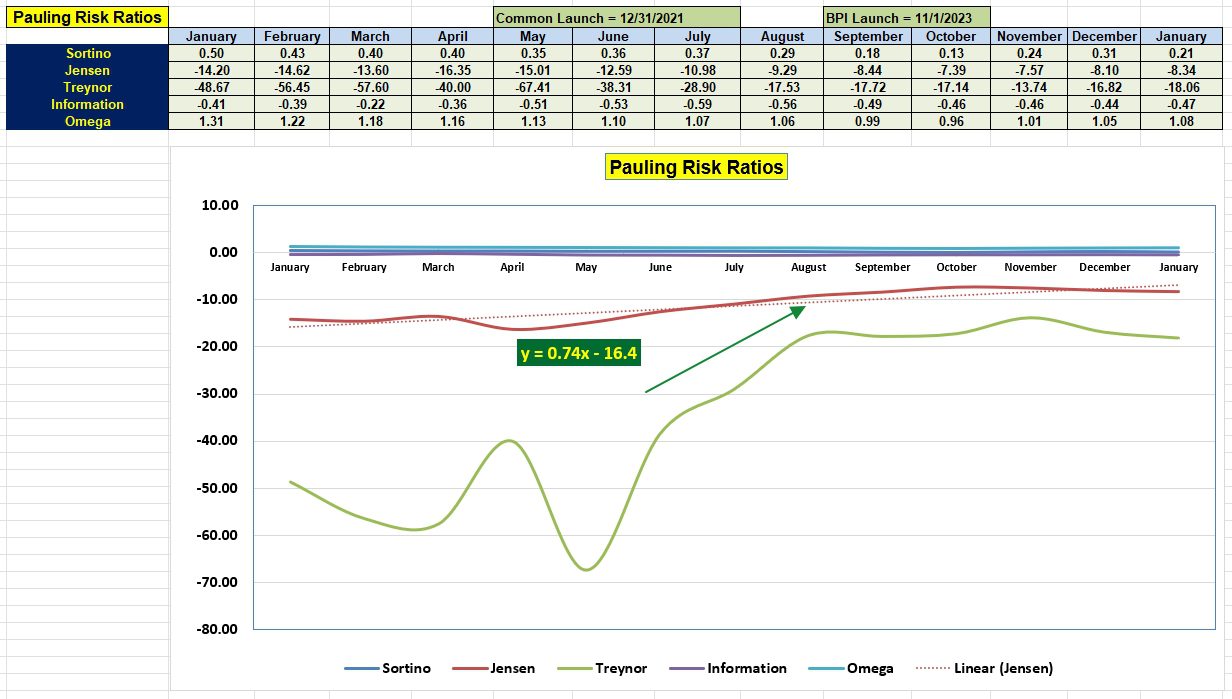
Pauling Risk Ratios
The best news to emerge from the following risk table is the slope (0.74) of the Jensen. In a head to head comparison with SPY the Information Ratio is steady. We have yet to see the Pauling pull ahead of SPY.
Pauling, as with several other ITA Sector BPI portfolios, will need to wait several months before we know if this investment model is adding alpha to the portfolio. The last table indicates the model is working as laid out in the hypothesis.
Sector BPI Portfolios Report
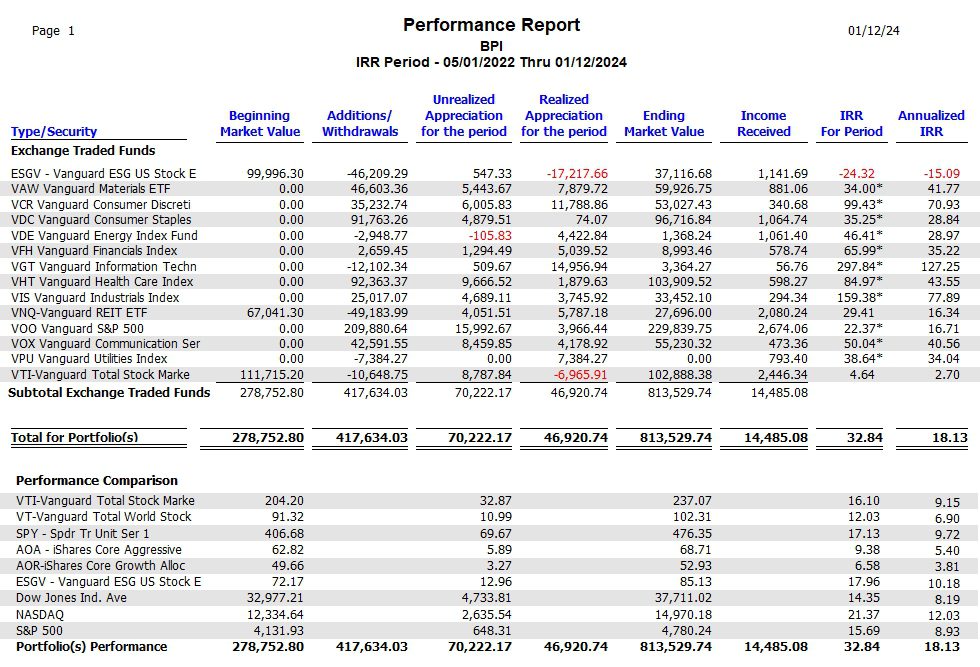
The following data pertains to more than the Pauling portfolio. This table includes data from all the Sector BPI portfolios going back to slightly before any of the portfolios held any sector ETFs other than VNQ. The beginning market values in ESGV, VNQ, and VTI were carry overs from when most of these portfolios were managed using the Dual Momentum™ or Relative Strength investing models.
As readers can see, the Sector BPI model with an 18.1% annualized rate nearly doubles the SPY (9.7%) benchmark. Once more, the contributions from the sector ETFs far outpace the contributions from ESGV and VTI. VOO has a better record. The different percentages for VTI, as an example, are due to different investing periods. The VTI benchmark of 9.15% is the return over the entire time frame while the portfolio VTI (2.7%) is the annualized return for times when VTI was part of one of the eleven Sector BPI portfolios. I hope this distinction is clear. When it comes to investing in broad market ETFs, Buy and Hold is an excellent approach. Check out the Copernicus if interested in this approach to retirement preparation.
Adding VTI, VOO, and ESGV to the investment quiver is so the portfolios are able to stay “fully” invested during periods when many of the sectors are positioned in the neutral zone or times when they are neither oversold or overbought. I put “fully” in quotes as there are times when the portfolios are carrying quite a bit of cash. That is the situation right now with many portfolios including the Pauling.
Gauss Sector BPI Portfolio Update: 3 January 2024
Millikan Sector BPI Update: 20 July 2023
Tweaking Sector BPI Plus Model: 20 May 2023
Tweaking Sector BPI Plus Investing Model: Part II
Discover more from ITA Wealth Management
Subscribe to get the latest posts sent to your email.
You must be logged in to post a comment.