
Lake Oswego Street Sculpture
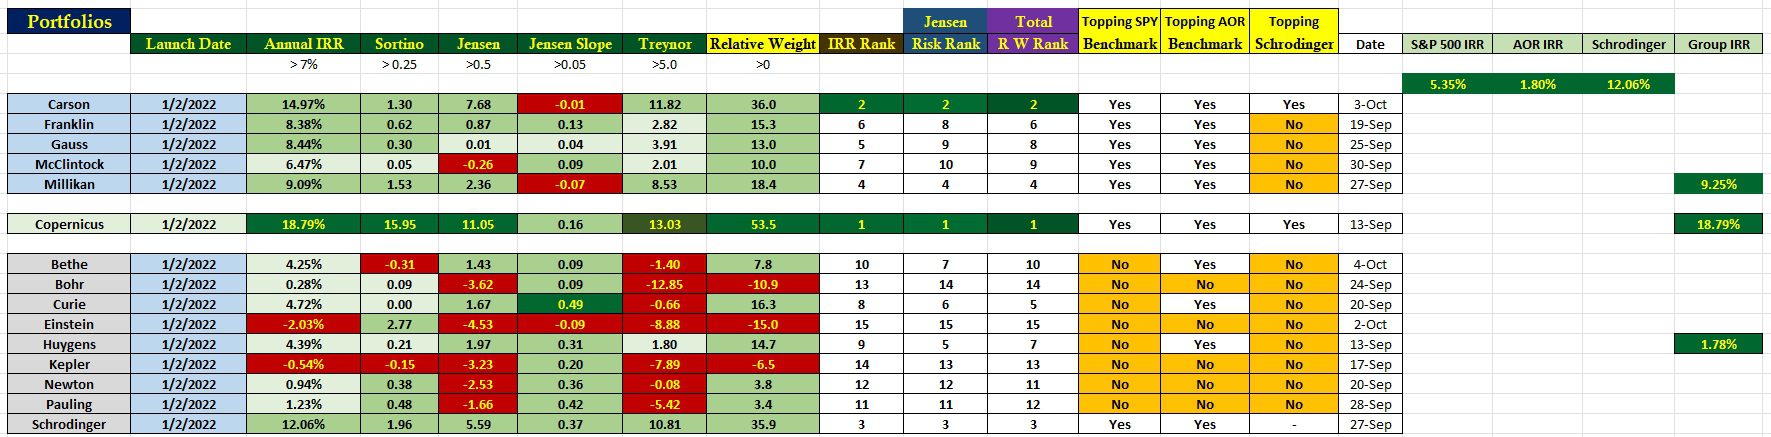
In response to Lee’s question, the following table shows the relative performance data for the fifteen (15) portfolios I track here at ITA Wealth Management. The spreadsheet requires some explanation as not all data is current as of 4 October 2024. The spreadsheet is updated on a rotating basis as I review and update different portfolios. The table does not include portfolios monitored by Hedgehunter.
While many portfolios are much older than the Launch Date of 1/2/2022, I use that starting date as a few portfolios were launched early in January of 2022 or late December of 2021. A common launch date allows for useful comparisons. A few of the portfolios actually date back into the late 1970s or early 1980s or around the time portfolio tracking software became available. A few of you may recall Disk-Based Operating Systems (DOS) programs. I was using such software when I first began tracking portfolio performance. A few of the portfolios date back before I had access to personal computers.
In the third column from the left readers will find the Internal Rate of Return for each portfolio. That percentage is accurate as of 4 October 2024. However, if the portfolio has not been recently reviewed, third quarter dividends will not be reflected in the IRR values. This is not to imply the Einstein and Kepler will suddenly pop into positive territory. In defense of the Einstein and Kepler, both portfolios experienced withdrawals by the owners at inopportune times as cash was needed for education and other personal expenses.
ITA Portfolio Relative Performance Data Table
And now for additional explanations to help reader interpret the following table.
- Portfolios Carson down to Millikan are Sector BPI portfolios.
- Copernicus is a stand alone portfolio as investments are strictly limited to U.S. Equities. The goal is to outperform the S&P 500 index.
- Portfolios Bethe through Schrodinger are Asset Allocation portfolios. All but the Schrodinger are relatively new to this investing model. Schrodinger stands alone in the sense it is managed by a computer at Schwab and is called an Intelligent Portfolio.
- The fifth column from the right (Date) identifies the date when I last reviewed or updated a portfolio.
- The Jensen Slope is an important column as it shows if a portfolio is improving when risk is taken into account.
- Relative Weight is a proprietary calculation where I take into account the IRR, Sortino, Jensen, Jensen Slope, and Treynor values to come up with a relative weight. Different columns receive different weights depending on how I rank importance.
- The far right-hand column shows the IRR value for the different investing models. For example, the five Sector BPI portfolios, as a group, are generating an annualized IRR of 9.25%.
- While the Asset Allocation (AA) portfolios (Bethe through Schrodinger) are lagging the benchmarks it is important to note that most are new to the AA investing model. This is not an excuse, but important to keep in mind. Exclude the Schrodinger from this concern as it is performing very well and has a longer history of operating as an AA portfolio. With Bethe through Pauling pay particular attention to the Jensen Slope as that will provide clues as to whether the Asset Allocation model is working.
- The row showing > percentages are my personal standards for acceptable performance. If the cell is red or light green the performance is below the acceptable value.
If there are questions about any parts of this data table post your questions or comments in the Comment section provided below.
Discover more from ITA Wealth Management
Subscribe to get the latest posts sent to your email.
You must be logged in to post a comment.