
Tree-line Walkway, Tarangoa, New Zealand
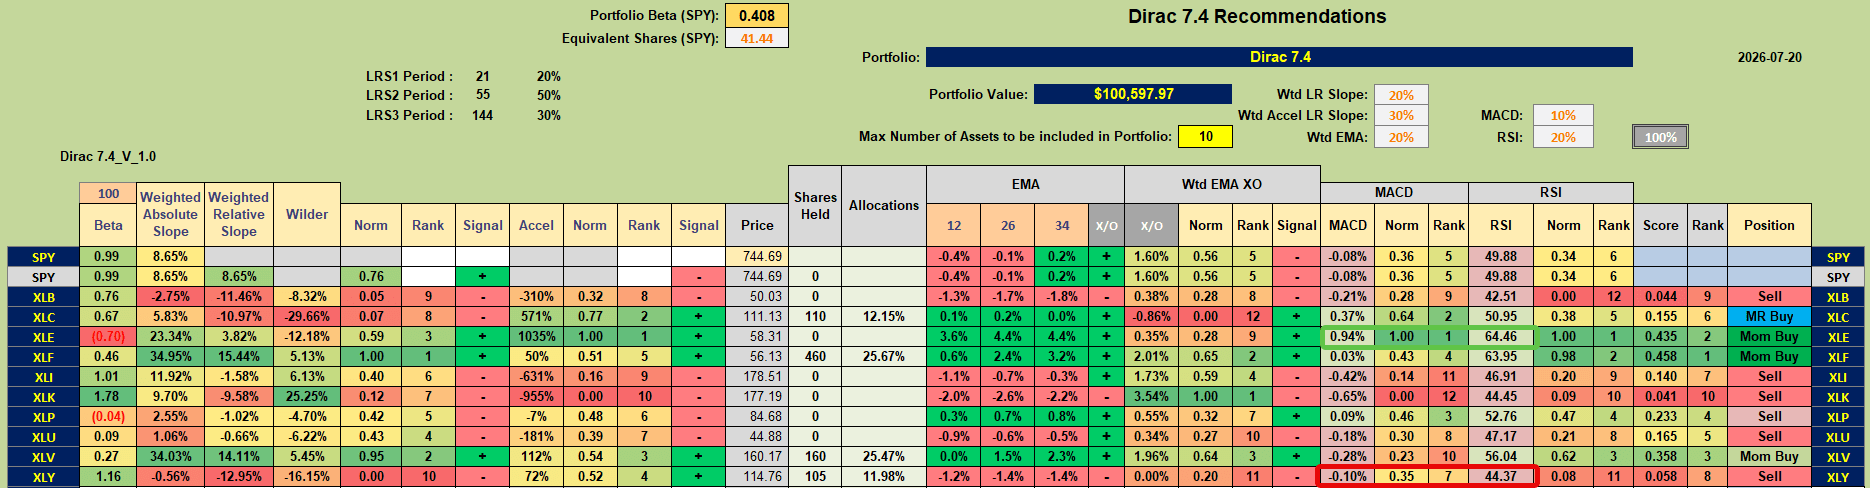
Since my last review I have made 3 adjustments to the Dirac Portfolio (red box):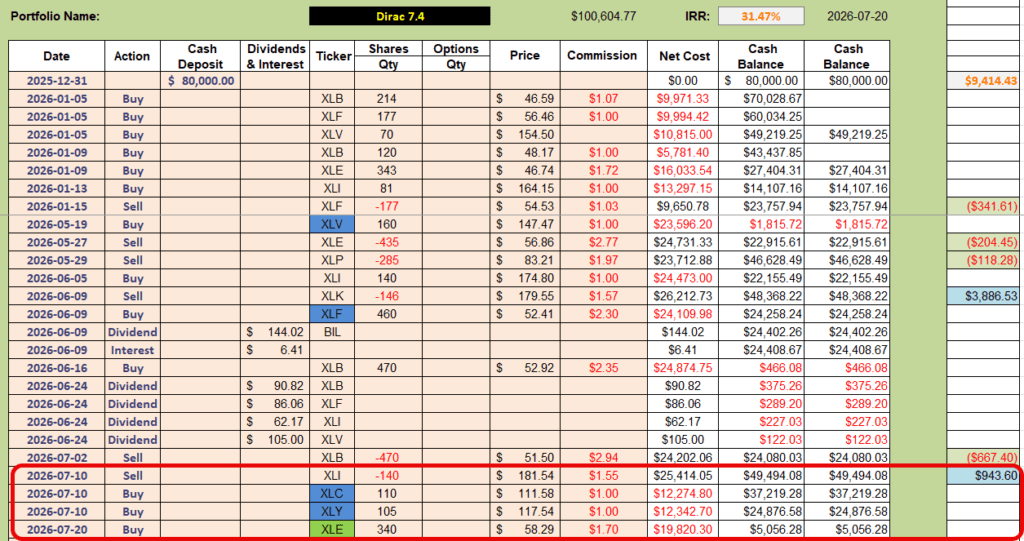
On 7 July I got a Sell Signal for XLI (Industrials) in the analysis sheet with the momentum/acceleration graph looking like this:
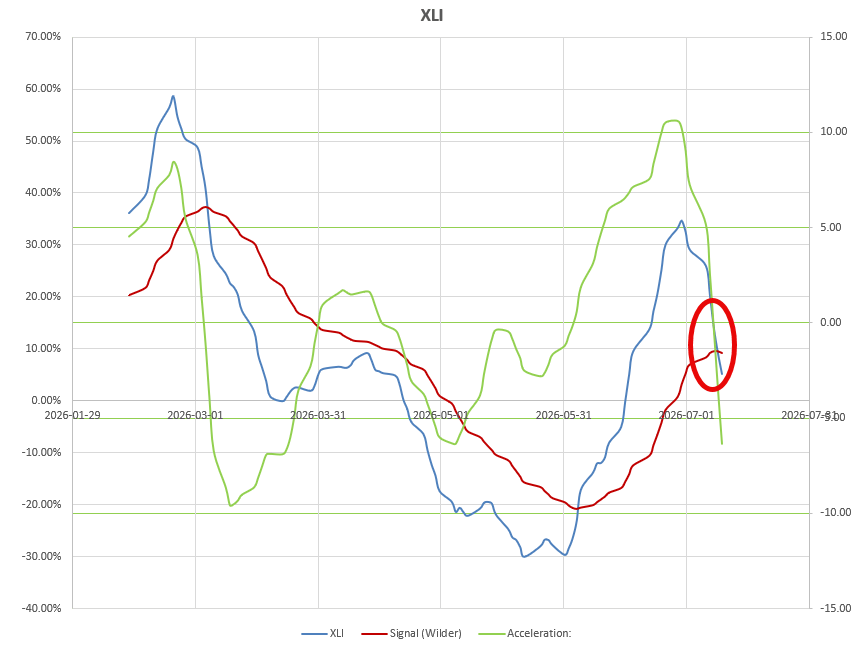 with momentum (blue line) crossing below it’s 14-period Wilder Moving Average and acceleration (green line) falling strongly negative. I therefore sold my position in XLI to lock in a nice ~$940 profit.
At the same time I had buy signals for the XLC (Communications) and XLY (Consumer Discretionary) Sectors – but these were not super-strong signals:
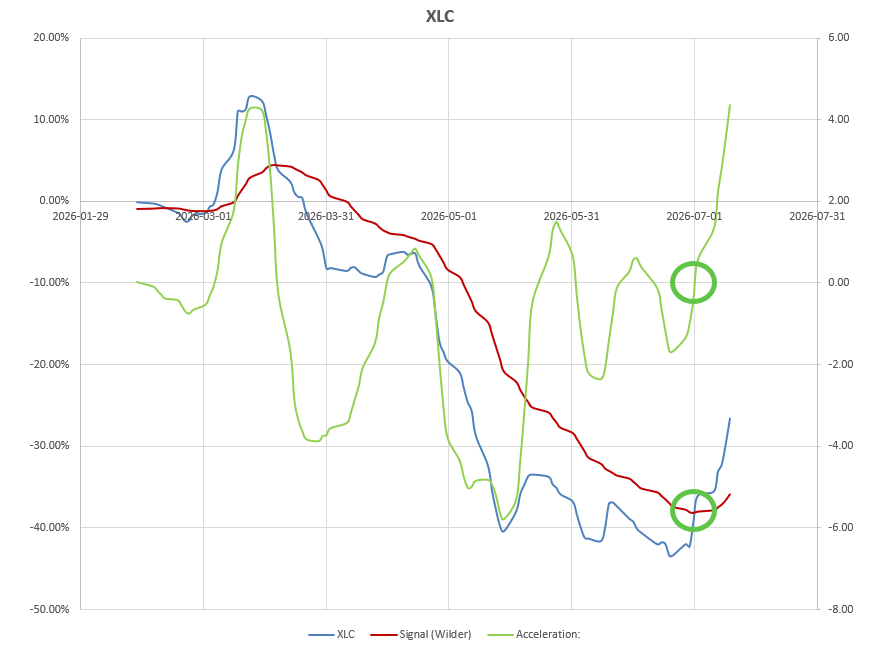
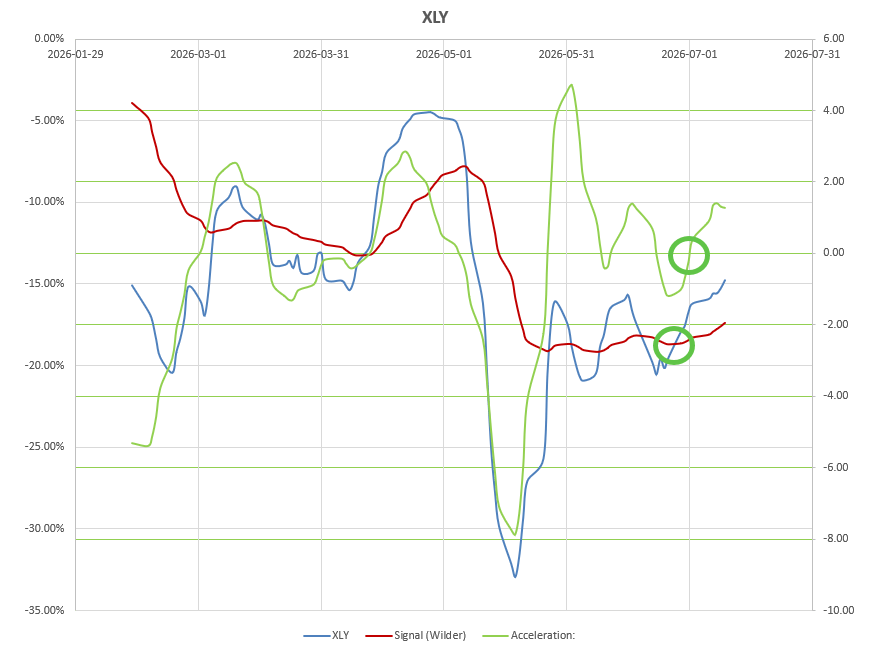 and confirmations from the shorter-term MACD and RSI Indicators were mixed – so I decided to add only “half-lots” of these ETFs to the portfolio by splitting the proceeds of the XLI sale between the two ETF’s.
Today (20 July) I got a Buy signal for XLE (Energy):
 with positive signals from the momentum/acceleration graphs:
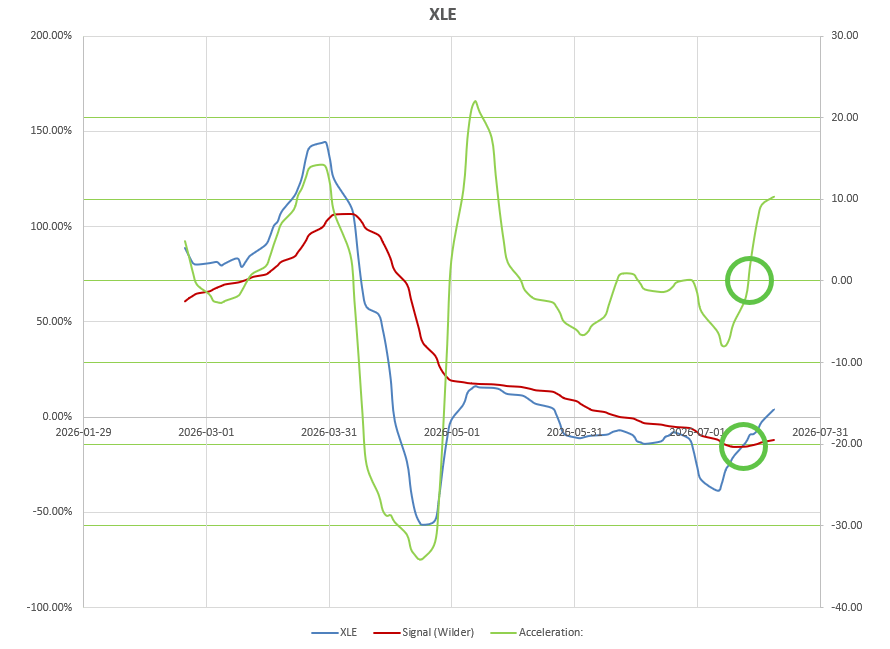
and confirmatory signals from the MACD and RSI Indicators (green box in the analysis screenshot above) – so I have purchased shares in this ETF to get me close to 100% invested.
We know that there has been little bullish movement in the US equity markets over the past ~3 months, with the S&P 500 Index trading in a sideways consolidation range – so we would not expect to see strong performance from this portfolio. Performance year-to-date looks like this:
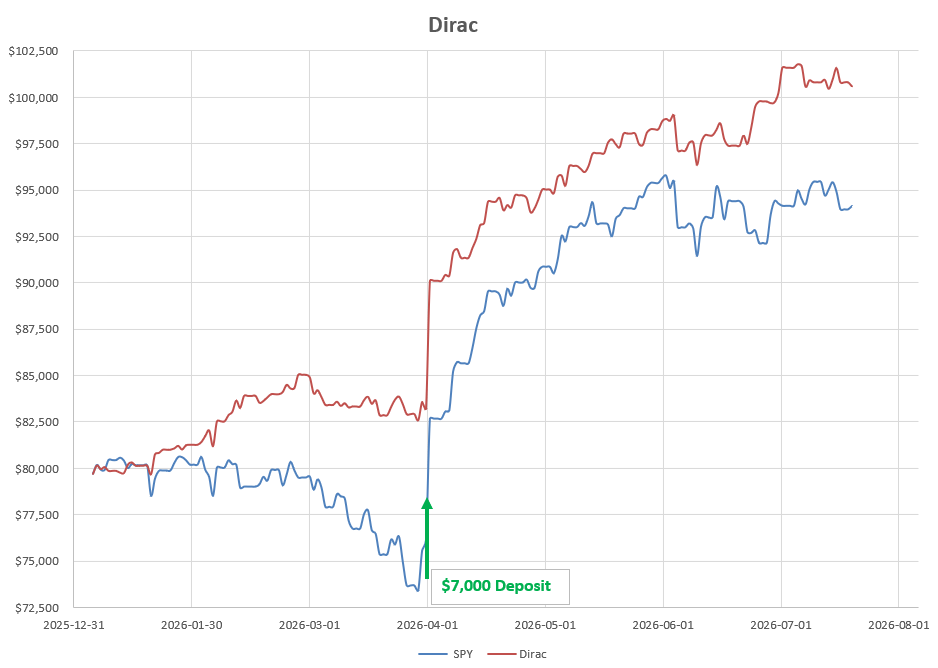 that looks quite respectable with a ~31% Internal Rate of Return (IRR) over the period.
The analysis sheet is suggesting a Sell for XLY but the momentum/acceleration graphs are not supporting this so I will hold on to my “half-lot” and continue to monitor the situation.
Discover more from ITA Wealth Management
Subscribe to get the latest posts sent to your email.
Leave a Comment or Question