
Painted Hills – Central Oregon
Change is the investor’s only certainty. – T. Rowe Price, Jr.
Huygens is the Sector BPI portfolio up for review today. In this review I’ve included what I call the Portfolio Sector Report. Readers will find it is the fifth screenshot. The reason for including this information is so those using the Sector BPI model can gain further insights into the viability of this investing method.
Huygens Investment Quiver and Holdings
Below is the current investment quiver and holdings in the Huygens portfolio. Note that Utilities (VPU) is fully populated as this sector dropped into the oversold zone a few days ago. I posted a Comment and information in the Forum to this effect. I assume all readers picked up this useful information. Check in on the Forum from time to time to see if there are unread messages.

Huygens Manual Risk Adjustments
Limit orders are in to add 30 more shares of ESGV. I also have a limit order in to add 10 more shares of VPU. This order is not really needed as Utilities (VPU) currently meets the minimum recommendation. I realized I failed to adjust the cash holdings and this error altered the recommendation for more shares of VPU. This mistake is not going to cause a problem as the Huygens is still holding excess cash.
Limit orders are in place to beef up both ESGV and VOO even though both are over subscribed.

Huygens Performance Data
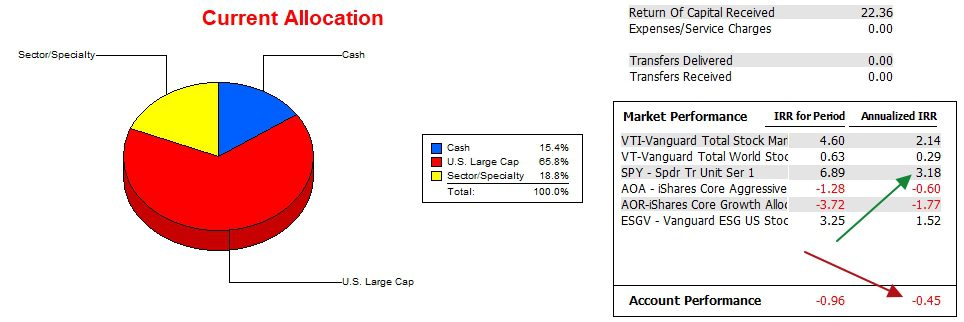
Since 12/31/2021 the Huygens continues to lag the SPY benchmark by 3.6 percentage points.
Huygens Risk Ratios
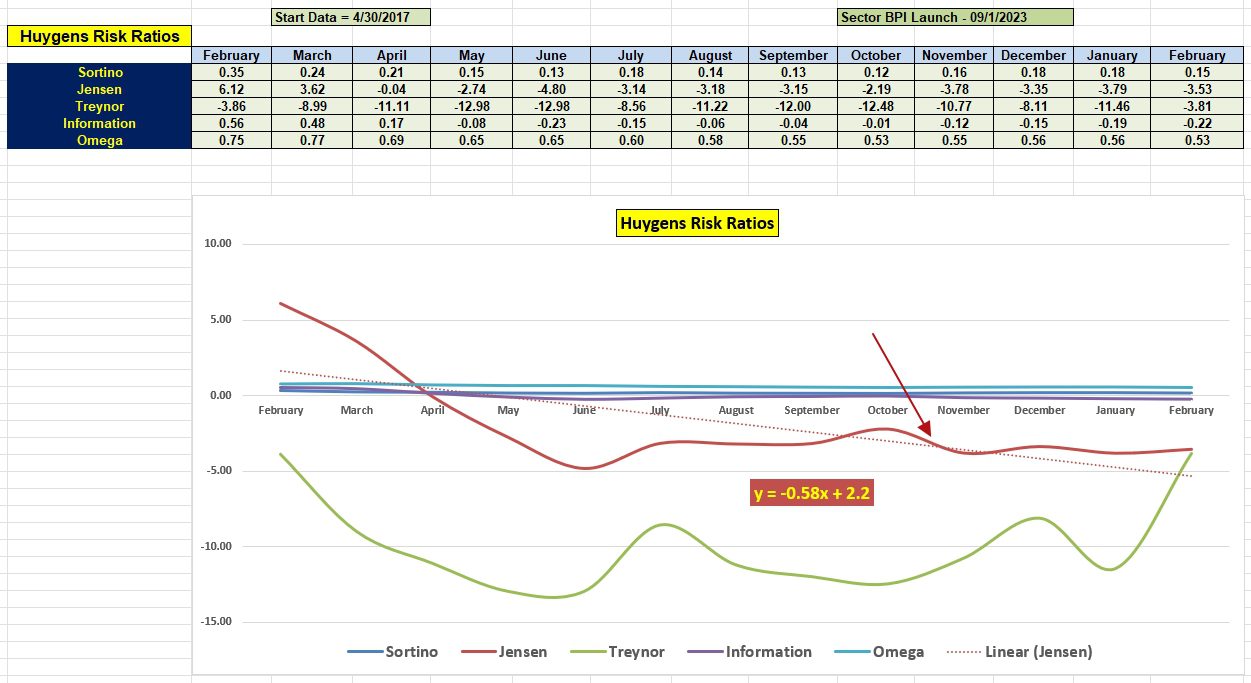
The Huygens moved to the Sector BPI investing model sometime last October so we don’t have much history to build a strong argument. The latest data is not all that positive, particularly when we check on the Information Ratio.
The Jensen improved slightly since January, but the trend (slope of Jensen) is still negative (-0.58).
Huygens Portfolio Sector Report
When we check the Sector Performance Report we are encouraged as to how well the sectors performed over the last few months. The advantage over SPY is not great, but we grasp for any positive data.

Comments and questions are always welcome.
Discover more from ITA Wealth Management
Subscribe to get the latest posts sent to your email.
HI LOWELL
Can you remind us as to how you determined the Max AA for the sectors?
Bob
Bob,
I use the three-year annualized volatility percentage found in the fifth column from the left edge in the Manual Risk Adjustment worksheet (second from the top in this blog). In the Main Menu worksheet of the Kipling spreadsheet I enter a coefficient value so the sum of the eleven sector volatility percentages add to 100%. Right now that coefficient value is close to 0.54.
The idea is to invest a bit more in sectors that have the highest volatility as they are more likely to moving into the oversold and overbought zones. Another option would be to invest 9% in each of the eleven sectors.
Hope I answered your question.
Lowell
Lowell,
Yes it does. Thanks.
Bob