Plane display at Evergreen Aviation and Space Museum.
This particular blog post is another example of how to address a potential weakness in the Sector BPI investing model. The Gauss portfolio is one of four Sector BPI portfolios so it is an appropriate candidate for this change.
Gauss Investment Quiver
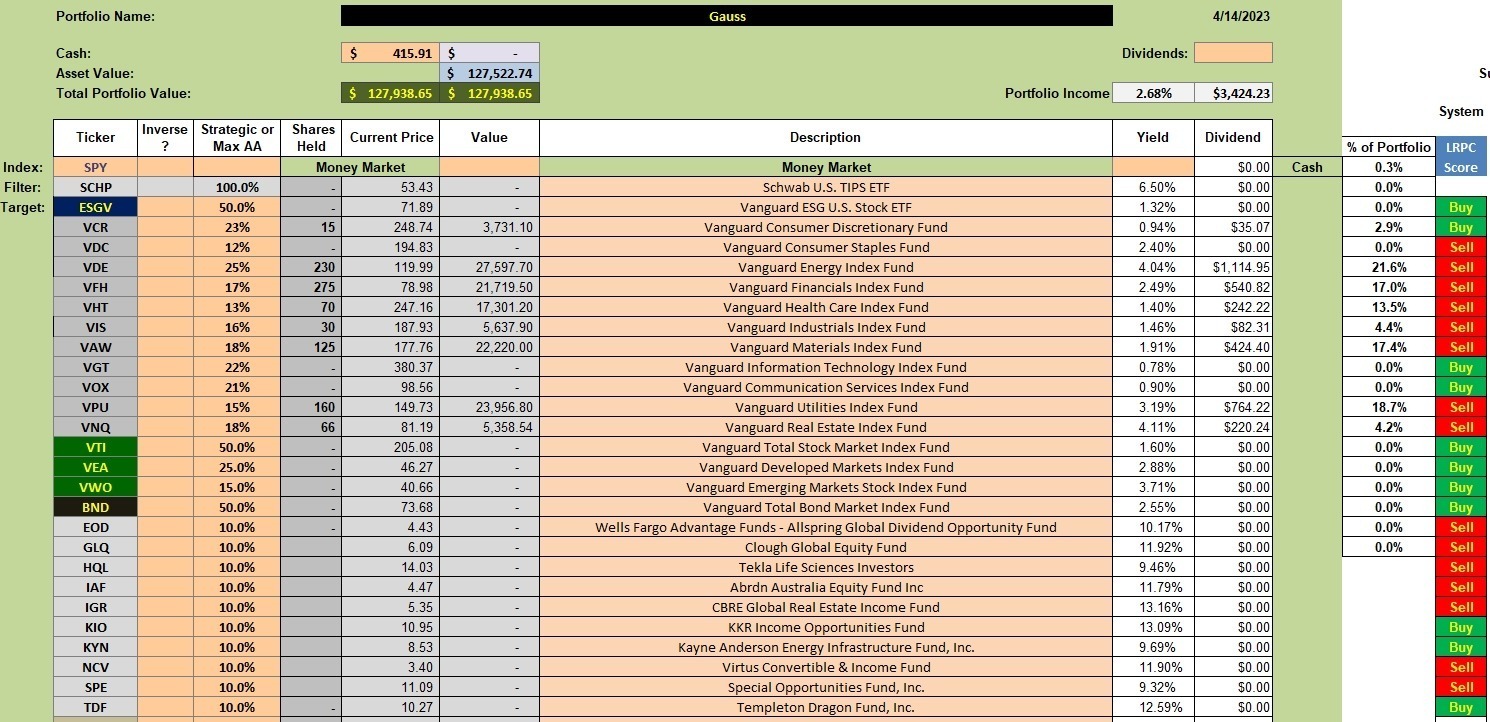
The following investment quiver is an expansion of the Sector BPI model and the securities are arranged in the order of importance when looked as groups. The three groups are:
- Sector ETFs shown as VCR through VNQ.
- Dual Momentum™ ETFs shown as VTI through BND.
- Income CEFs shown EOD through TDF.
I anticipate groups one and two will not change. The income CEFs will likely change from time to time depending whether or not the CEFs meet the requirements of income and NAV.
As the portfolio currently stands, all is acceptable with exception of VNQ. When Real Estate was in the oversold zone there was insufficient cash to bring the percentage up to the 18% level. At 4.2% Real Estate is under funded. At this point, even if more cash were available I would not purchase shares of VNQ as Real Estate is now out of the oversold zone.

Gauss Security Recommendations
As mentioned above, no changes are planned for the Gauss. As a point of argument assume one or more of the current TSLOs will be activated and cash becomes available. Or the owner of this portfolio may add more cash to the account. How should this new influx of cash be reinvested?
- We first check to see if any sectors are oversold. Based on current data there are no Buy recommendations for sectors.
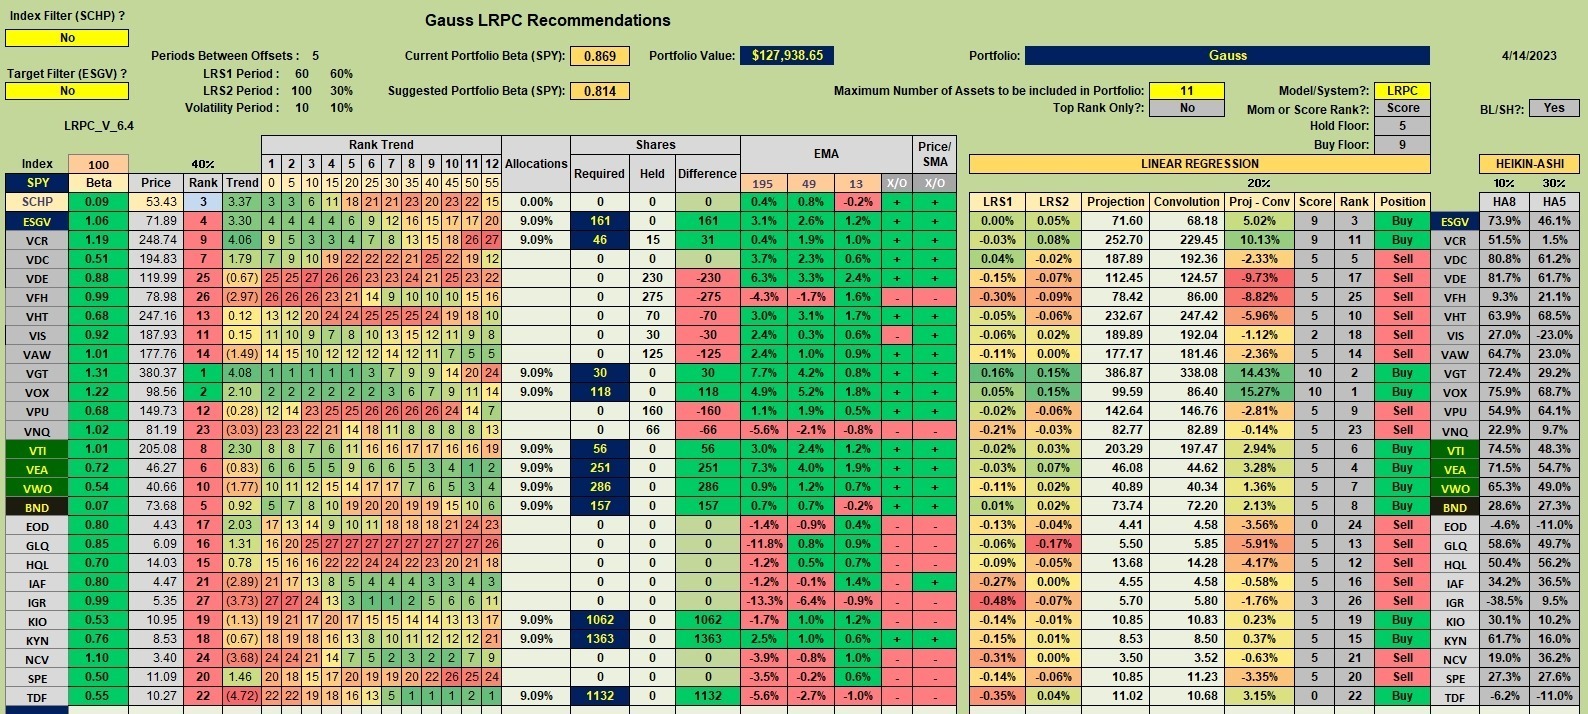
- We next move down to the Dual Momentum section of the investment quiver and check to see if VTI, VEA, VWO, or BND are recommended. In the worksheet below we see where all four are recommended. It is unlikely cash is available to invest in all four so I would fill them based on the ranking shown in the 4th column from the left. Fill BND first, followed by VEA.
- If none of the Dual Momentum securities showed up as a Buy then move down into the CEFs and begin to use up all available cash by adding income generating CEFs.
A few things to point out in the following worksheet.
- I have the Target Filter turned off as it is not important based on how I am managing this portfolio.
- I am using the default 60- and 100-trading days look-back. I vacillate whether to use this combination or go with the one-year look-back period.
- I have the Maximum Number of Assets set to 11 so I can include all eleven sectors. In the future I might move this up to 15. I don’t see it as too critical for the Gauss.
- With the Gauss I set the Model/System to LRPC. I tend to go back and forth between LRPC and BHS. If one wishes to reduce portfolio churning, then use a one-year look-back period and apply the LRPC model.

Gauss Performance Data
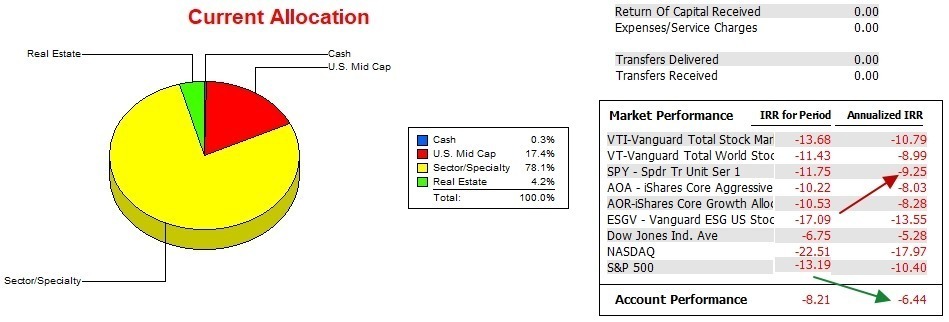
While we are looking at the Gauss, how is it performing with respect to the S&P 500? Over the past 15.5 months the Gauss has a nice margin over SPY as well as a lead over both AOA and AOR. The column on the right is annualized while the left column is the IRR for the period under investigation.
This data comes from the Information Account Manager commercial software program, software I highly recommend for all serious investors.

Gauss Risk Ratios
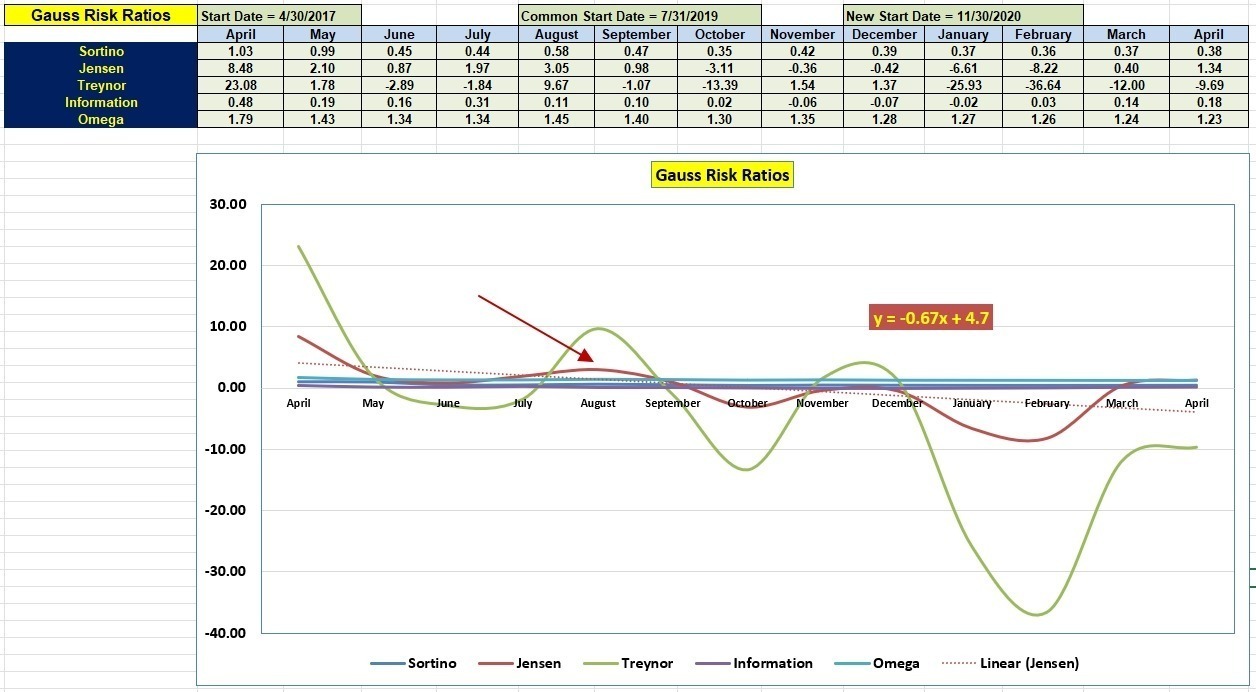
While the above table hones in on the Internal Rate of Return (IRR) data, the following data table is something you will not see on other investment blog sites.
The current April data does not come close to reaching the April levels of 2022. Recall that I moved the Gauss from the Dual Momentum model to the Sector BPI model around the first of this year. We are beginning to see improvement in the Jensen Alpha values as well as growth in the Information Ratio. These are two important risk ratios to follow. Third in line is the Sortino as it informs us if the portfolio is gaining in value.

Gauss Portfolio Update: 19 March 2023
Discover more from ITA Wealth Management
Subscribe to get the latest posts sent to your email.
You must be logged in to post a comment.