
Sluice at Cedar Creek Grist Mill.
Most investors prefer to keep things simple, particularly if they are still working. If the investing model requires a little thought individuals are likely to avoid using it. While I don’t know how many readers are using the different models tracked here at ITA, I suspect most are applying the Schrodinger, Copernicus or one of the Dual Momentum™ models as those are the easiest to implement.
If I were to rank the different models in difficulty, the Sector BPI model requires about as much thought and decision making as the Dual Momentum™ model so it is not all that difficult to implement.
In this update of the Gauss portfolio some decisions are required as there is insufficient cash to fill all the requirements. I’ll explain as I go through this update.
Gauss Sector Investment Quiver
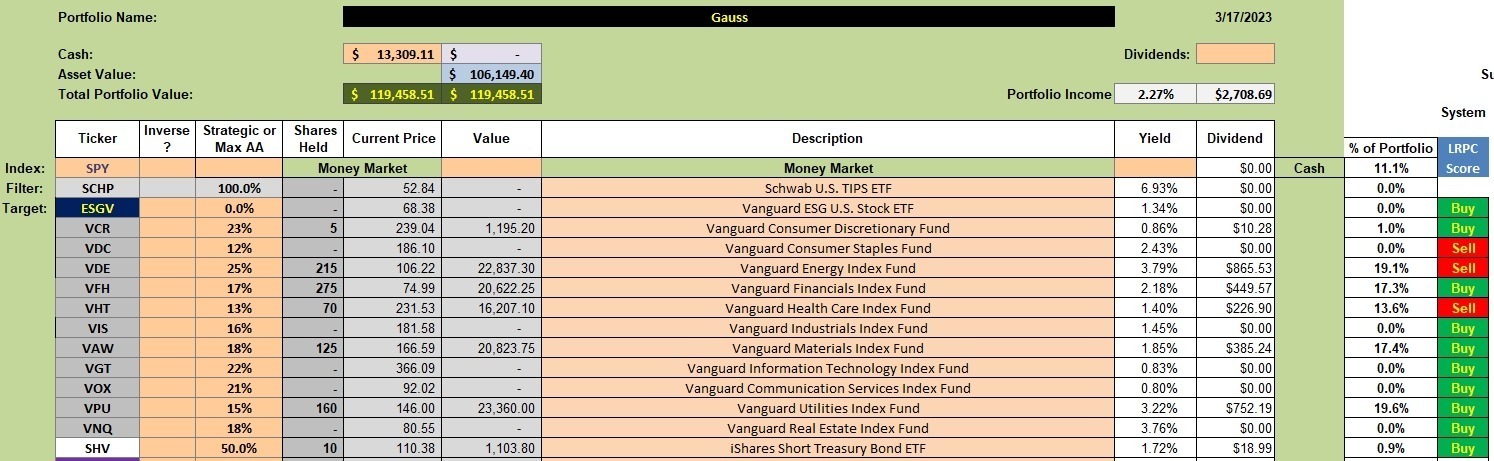
In the following table we have the list of sector ETFs and the current holdings. The available cash exceeds $13,000. As you will recall from last Friday’s BPI data six sectors were in the Buy or what I call the over-sold zone. Those sectors can be found if you go back to this BPI blog post. Check out the left side of the second data table.
Gauss Sector Manual Adjustments
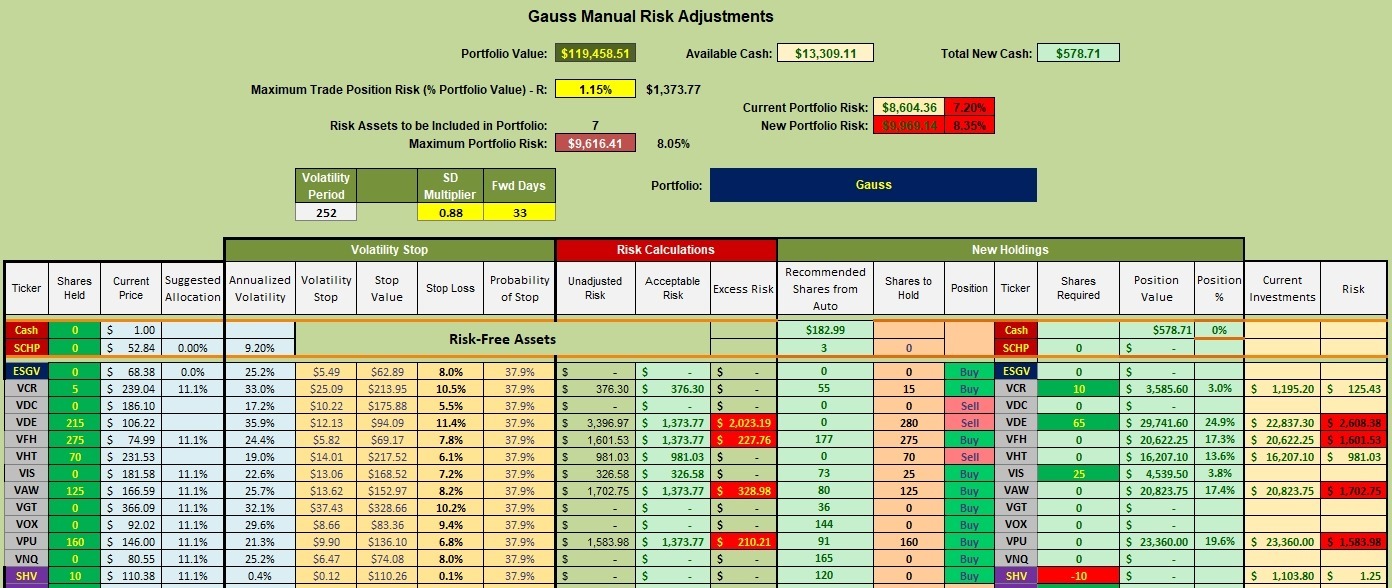
I use the manual risk adjustment worksheet from the Kipling spreadsheet as a guide to help determine how many shares of each sector ETF to purchase.
Important: I fill the sector most over-sold as it has the highest probability of rebounding quickly. Based on Friday’s data, that sector is Energy followed by VAW, VFH, VIS, VHT, and VCR.
The portfolio already holds shares of VPU from when it was over-sold. While the maximum percentage of VPU is 15%, it is now up to 19.6% due to the price rebound. I don’t plan to sell any shares of VPU as that would be outside the general sell rules.
- Buy 65 shares of VDE to fill that sector.
- VAW is second on the buy list and it is already at capacity so do nothing.
- VFH is also at the 17% capacity so do nothing.
- VIS is the fourth in line for filling and there is insufficient cash available to fill both VIS and VCR. This is where decisions need to be made. I plan to split the available cash between VIS and VCR so I have a few shares invested in each of the over-sold sectors.
- Note that I plan to sell 10 shares of SHV in order to raise more cash to purchase a few shares of VIS and VCR.
These decisions will leave the Gauss holding shares in each of the over-sold ETFs as well as shares in VPU which was over-sold not too many weeks back.
Gauss Performance Data
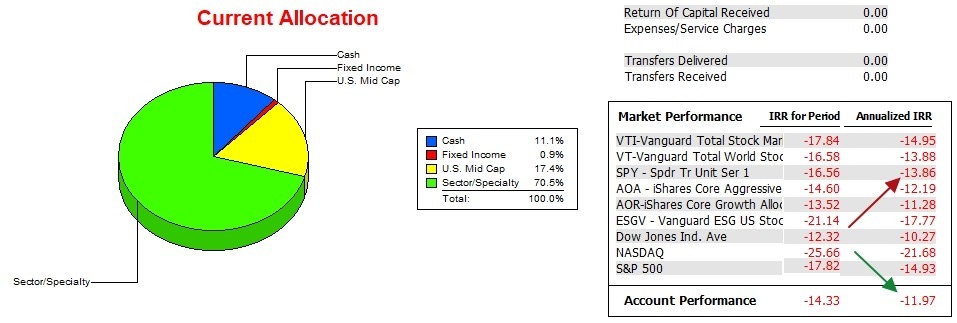
How is the Gauss performing with respect to its benchmark, the S&P 500. As readers can see from the data below, over the past 14 months the Gauss is out performing SPY by nearly two percentage points. While the Gauss has not been using the Sector BPI model over this full period, we gain some additional insights if we go to the risk ratios.
Gauss Risk Ratios
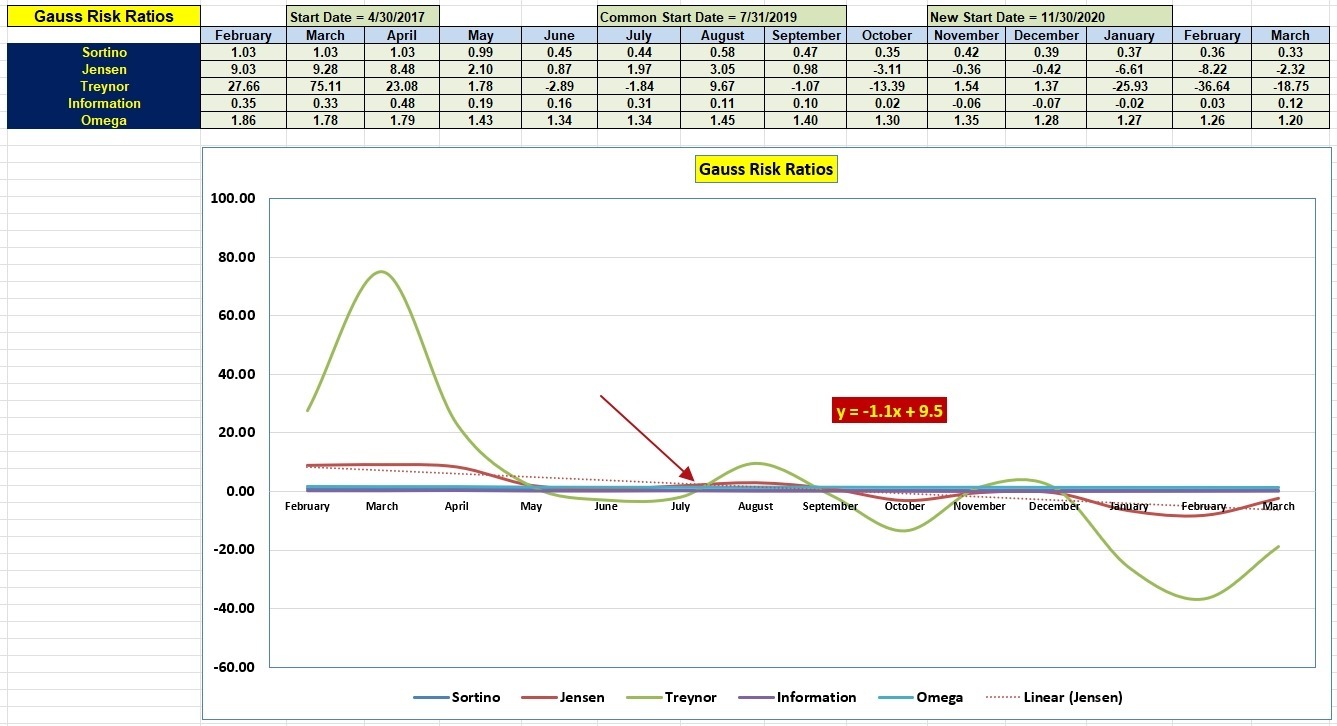
Check the Information Ratio which tells us how well the portfolio is performing with respect to its benchmark. We see improvement going back as far as August of 2022. Even more important is the current growth since last January.
Over the last few months the Jensen Alpha has also improved. That is quite significant. Now we need to see this trend continue and that is the ongoing test of the Sector BPI model.
Discover more from ITA Wealth Management
Subscribe to get the latest posts sent to your email.
You must be logged in to post a comment.