
Another Hero at Hero’s Square, Budapest
In my recent Rutherford Review Post I spent a little time describing some of the features of Fibonacci Technical Analysis. I mentioned that I don’t usually use this analysis for Investment purposes (other than, maybe, to help me set stop loss orders) but that I sometimes use it for other “trades”. For fun, since I have not posted anything on Options for a while, and as an example of how I might have used the information available to me on 14 October (but didn’t, hence the “If Only I had Been Smart Enough …” title of this post), when I accepted that we had moved out of the down channel:
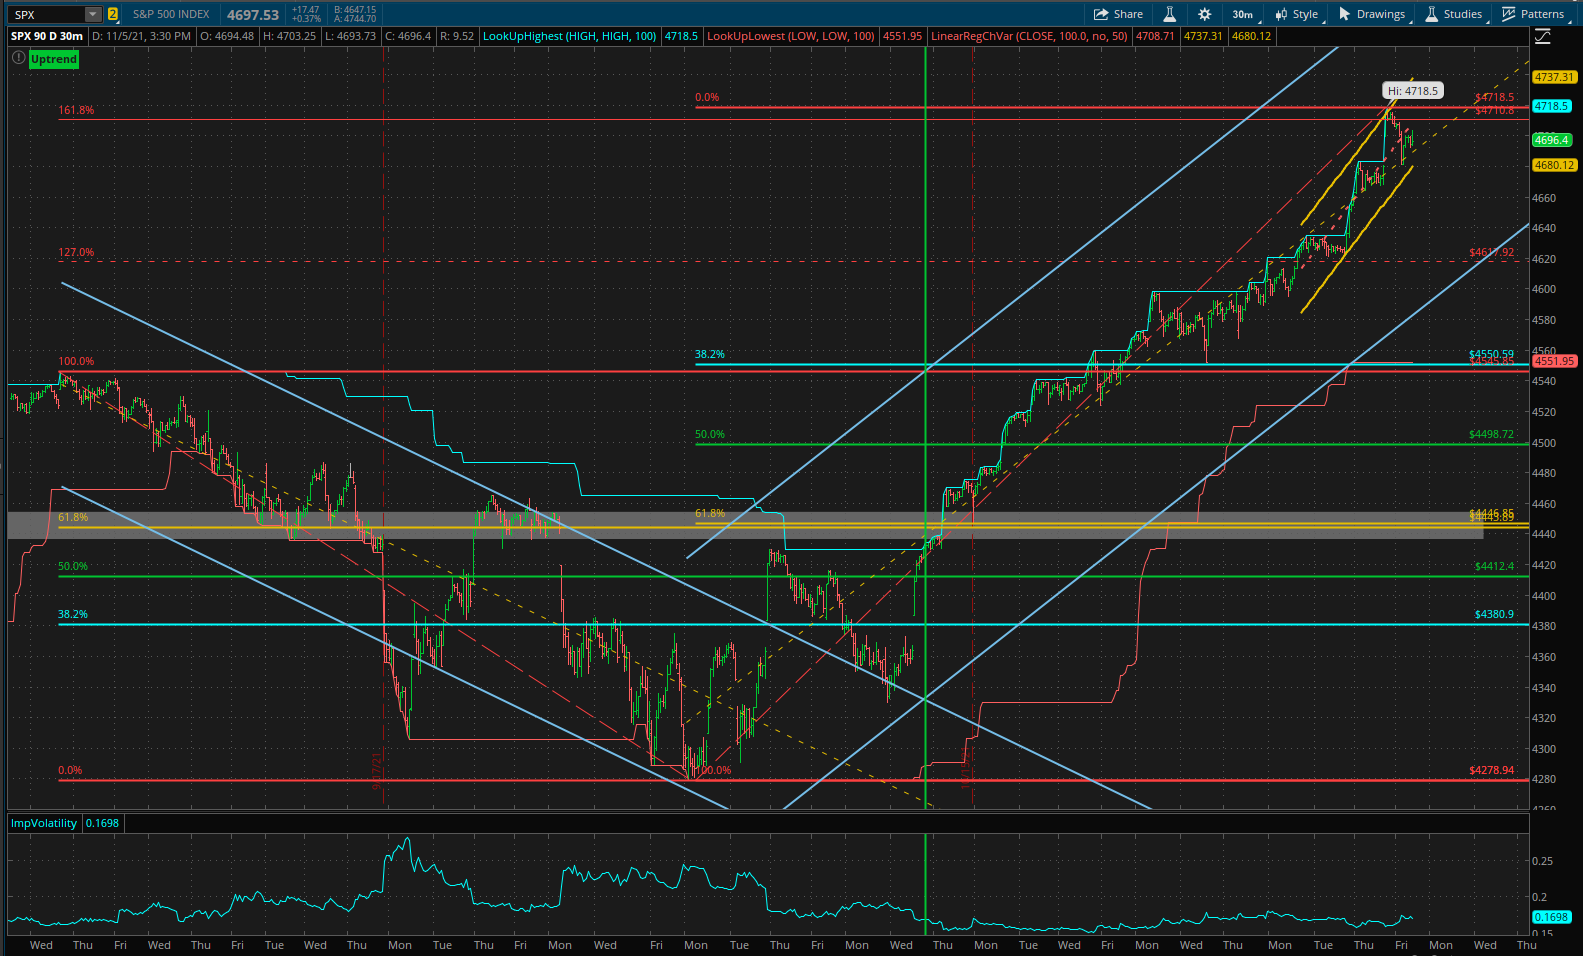 I drew the Fibonacci retracement levels from the 1 September high to the 4 October low that established the projected 161.8% retracement high (at an undefined time in the future) of ~4720. If I felt that this price was likely to be reached, and within about a month (the time spent in the downtrend), then I could have placed one of my favorite Option trades – an unbalanced Butterfly spread centered at 4720. Since we cannot trade the SPX I would have done this in SPY Options (one-tenth the size of SPX) and it might have looked like this:
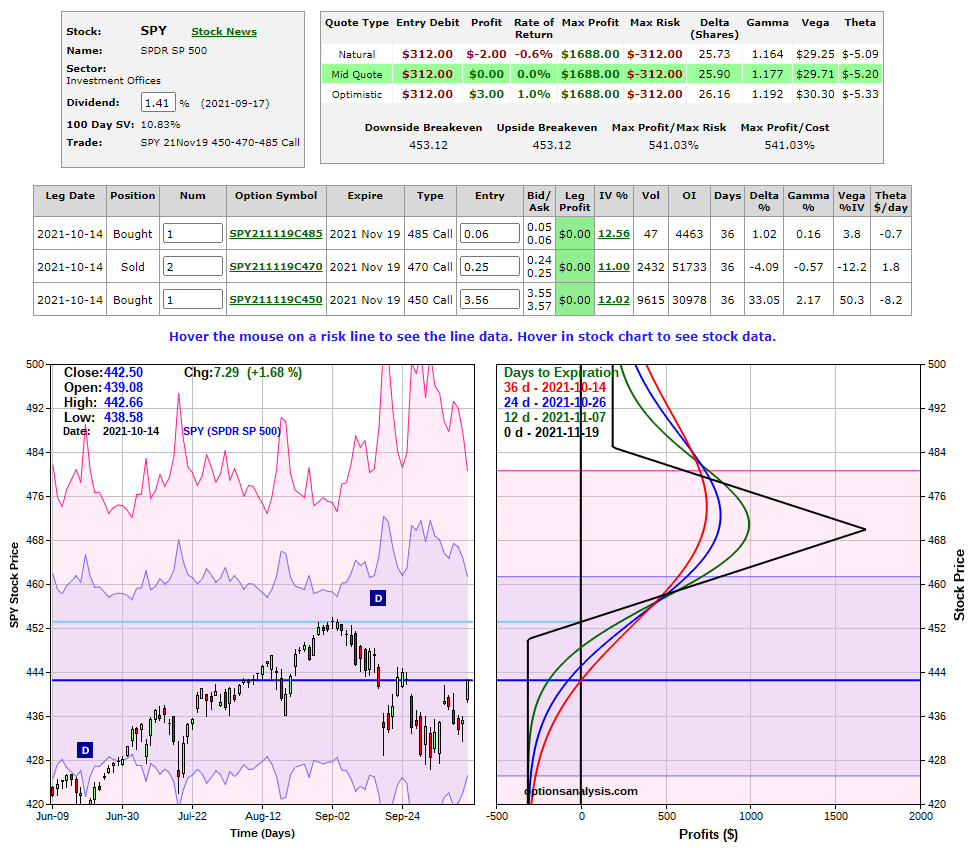 the important point here is that I have used the Fibonacci analysis to identify the center point of the Butterfly spread. This trade has a maximum risk of $312 if SPY does not move above 450 at expiration (4 Oct price = 442.5 – therefore ~1.7% move) – although I would not hold this to expiration so the potential loss is less than this and probably better than break-even with SPY at 450 – 12 days before expiration (~7 Nov, 3 weeks from when the trade would have been placed).
If we run this trade through to today we get the following picture:
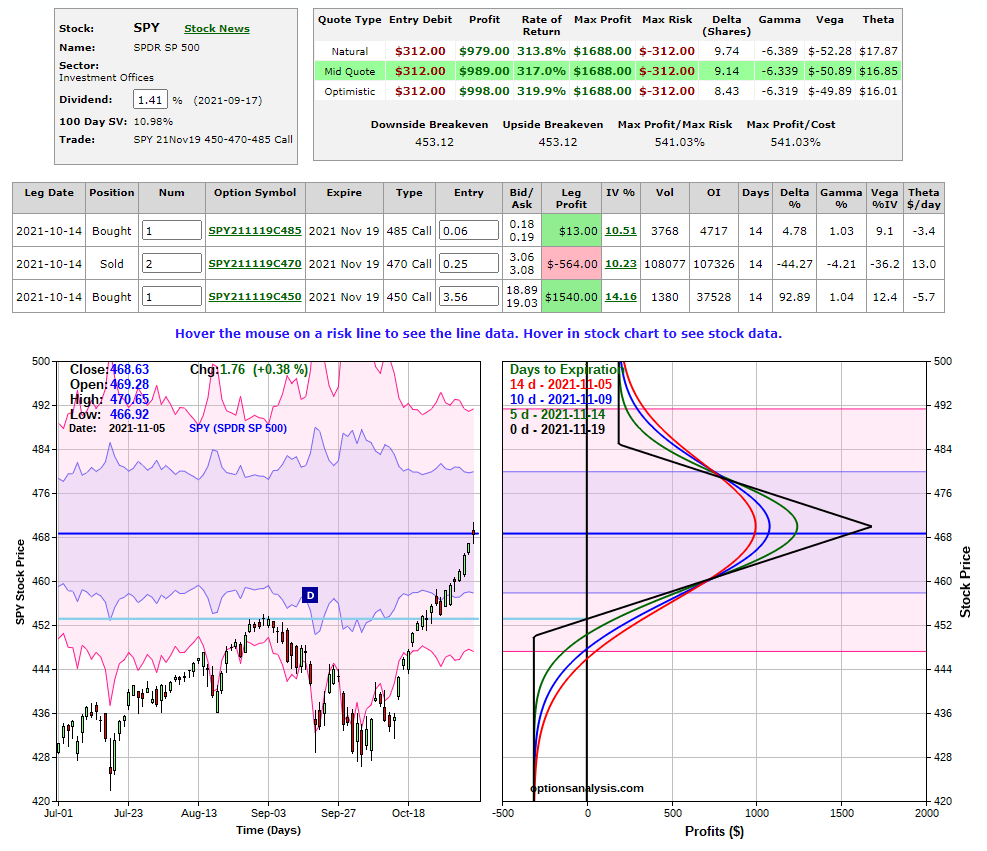 where we see a $989 profit – and I would be out of this trade with a 300% Return on Investment. I don’t think the probability of SPY closing at this level (~470) in 2 weeks time is worth the risk of holding the position in the hope of wringing the extra $800 theoretical maximum profit out of the trade. It would be too nerve wracking with significant risk of losing at least a portion of the $900 currently available.
Now, the above trade suggests that I was reasonably bullish on 14 October and thought that price might go through the 470 target price – so the position has no risk to the upside. If SPY continues higher, above 470, I am guaranteed at least $188 profit even if I do nothing.
However, I might not have been that bullish (and I’m not), so I might have been more worried about my losses to the downside. This being the case I could move my risk to the upside by “unbalancing” my Butterfly spread in the opposite direction:
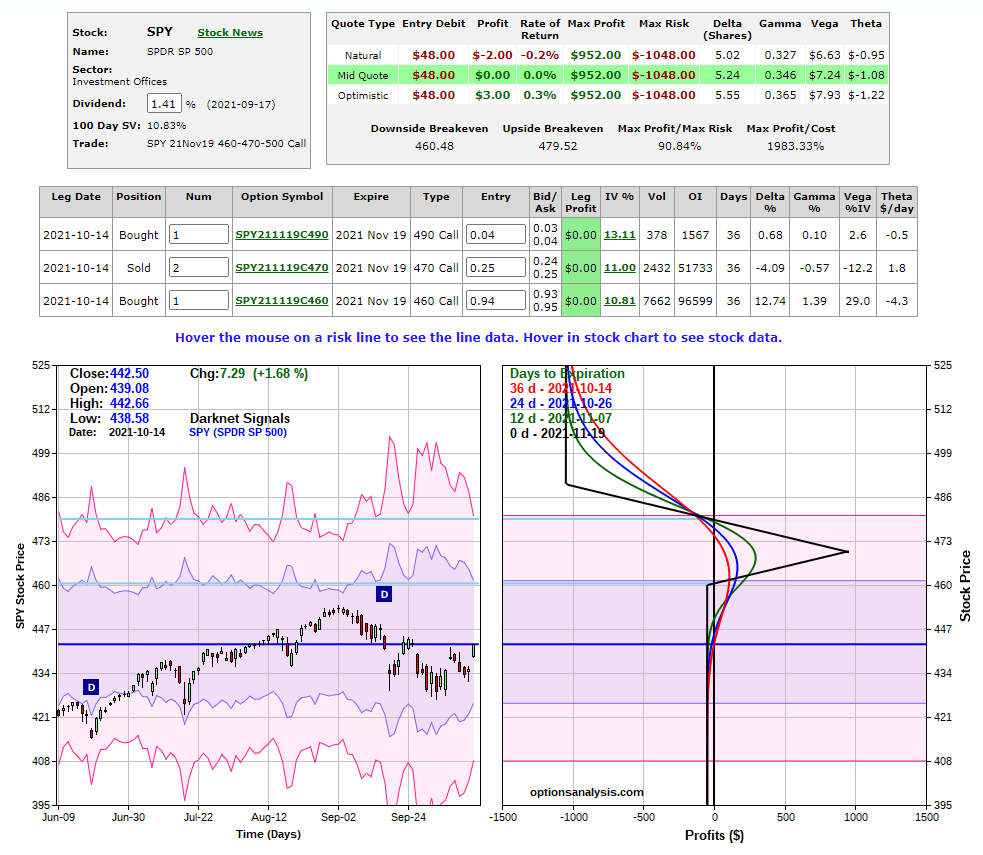 in this case I only have $48 at risk if SPY does little or nothing. SPY would have to close above ~480 at expiration before I would lose money – even if I did nothing – but I have to go through my maximum profit price of 470 before getting there – so I’m likely to exit before I get there. Maximum loss – if I fell asleep and did nothing – would be $1048 with price above 490 at expiration.
Fast forward this position to today:
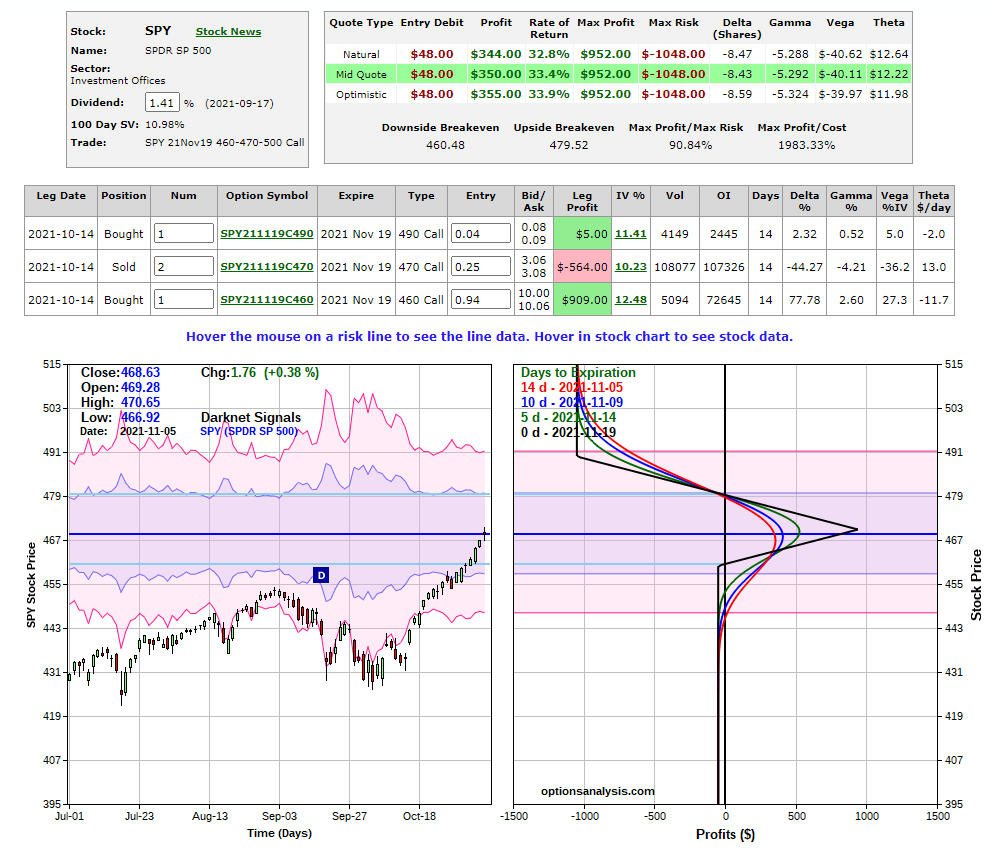 and we see that we have $350 profit – seven times (700%) the $48 most probable risk – but $550 less than the first trade above (where we had $312 risk rather than $48)..
We balance risk/reward and make our choice as to which (or other, similar, trade) might be more attractive to us – but, the main point here is that I would still be using the 470 price as the center price target for maximum profits for my butterfly trade.
David
Discover more from ITA Wealth Management
Subscribe to get the latest posts sent to your email.
You must be logged in to post a comment.