Highlands of Scotland
At the end of every year (at least) I take a look at my portfolios and ask myself the question – “Is it worth the effort trying to actively manage my portfolios rather than simply holding an Index fund ?” (for example).
As we see in many of our reviews it is very difficult to beat a fund that tracks a desired Index (e.g. SPX – S&P 500) or desired diversified portfolio of assets (e.g. AOR). So, if we are comfortable with the premise of our benchmark (focussed or wide), then why do we bother trying to beat it ? This question becomes more acute as we get older, have less time to focus and become more sensitive to risk. For me, personally, it is the risk aspect of investment that is more important than returns – or beating the benchmark. However, it is always a good question to ask ourselves from time to time.
As regular readers will be aware, Lowell is planning to keep his portfolios simpler going forward – and I would love to do the same – but I still have to ask myself how much risk am I prepared to take? and how will I manage that risk?
The Kahneman-Tversky (K-T) Portfolio is the simplest of the Portfolios that I review on this site and some readers may wonder why I haven’t posted a Review since August 2024 – although the portfolio is so boring, nobody may have noticed 🙂 .
The portfolio is split into two (2) parts, one that uses a slow moving (252 trading day) single momentum lookback period (the “Kahneman” portion), and one that uses faster moving (60- and 100-day) momentum lookback periods. Both portions choose from 1 of three ETFs (VTI, VEU or TLT) from which to invest – so the total portfolio will never hold more than 2 ETFs – one in each portion of the portolio and these may be the same ETF or different ETFs in each portion.
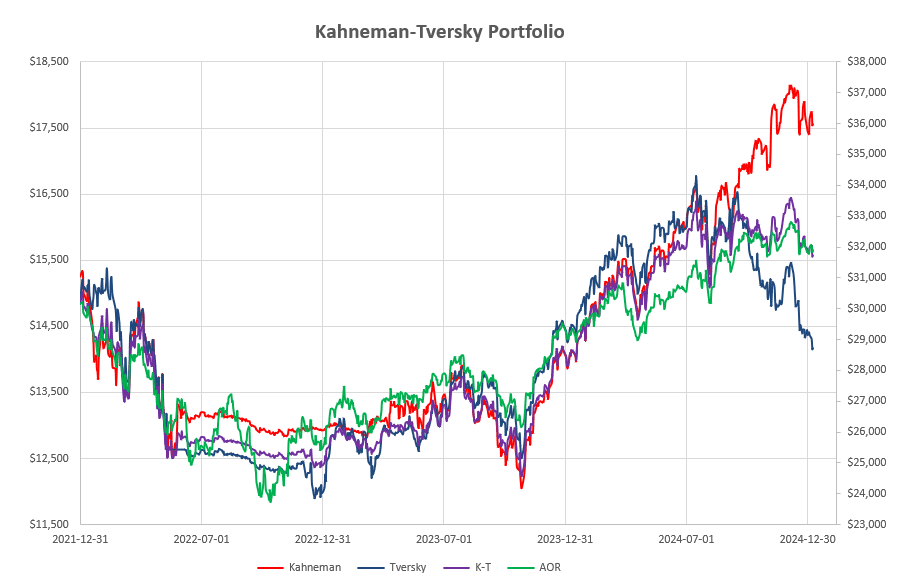
Here’s what the performance of this portfolio looks like to date:
 Now, you will note that, until my review in August 2024, there was not a lot of difference between the returns generated by the portfolio and the benchmark AOR Fund (A diversified fund of US and International Equities and Bonds) except for an obvious reduction in volatility in the June-September 2022 period. By the end of July 2024 the K-T portfolio (red line) was slightly outpacing the benchmark (green line). At present the K-T and AOR fund are both valued virtually identical. So, again, why bother to try to beat the benchmark?
Well, maybe the answer to that question, and an example of the impact of diversification (even from a 3-asset quiver), lies in the fact that I have made no changes/adjustments to this portfolio since the August review – at which time the portfolio was holding TLT (US Treasury Bonds) in the Tversky portion (dark blue line) and VTI (US Equities) in the Kahneman portion (red line) – or relatively similar to the equity/bond configuration of the AOR fund. So, it is not too surprising that the performance of the portfolio and the benchmark have ended up at the same value.
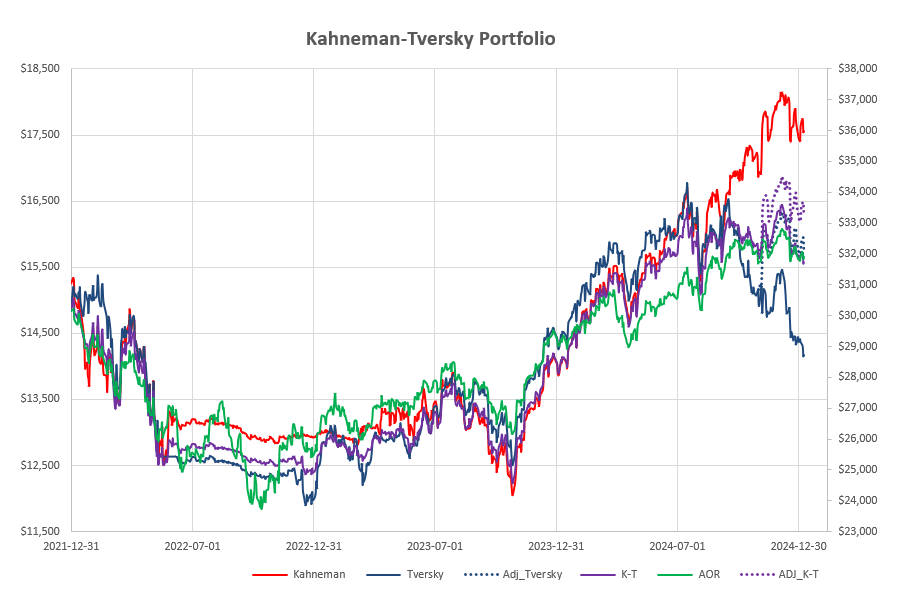
However, there was a change in the recommendation for the Tversky portfolio early in October when the numbers were suggesting a shift to VTI. Now, I don’t want to be accused of cherry picking, and I do go on a bit about the significance of timing/review date “luck”, so I’ll assume that I didn’t pick up this change in recommended holdings until the end of October (when I usually review and adjust). The impact of an adjustment at that time can be seen below:
 where the values of the Tversky portion and the Total K-T portfolio are shown by the dashed dark blue and purple lines from the end of October to the present time. The K-T portfolio is now leading the benchmark by ~$1,600 (~5% higher). So, is it worth the effort to actively manage your portfolios?
The above graphs also show an excellent example of the impact of diversification, where we have inversely correlated assets (at least in the September-December time frame) between equities and bonds – leading to an “allegator mouth” divergence in the individual asset returns – and a smoothing or reduction in volatility of the total portfolio as the impact of a movement by one is, at least partially, cancelled out by an inverse movement in the other . The Portolio shows a reduction in net returns compared with the better performing asset – but an improvement in returns from the weaker asset.
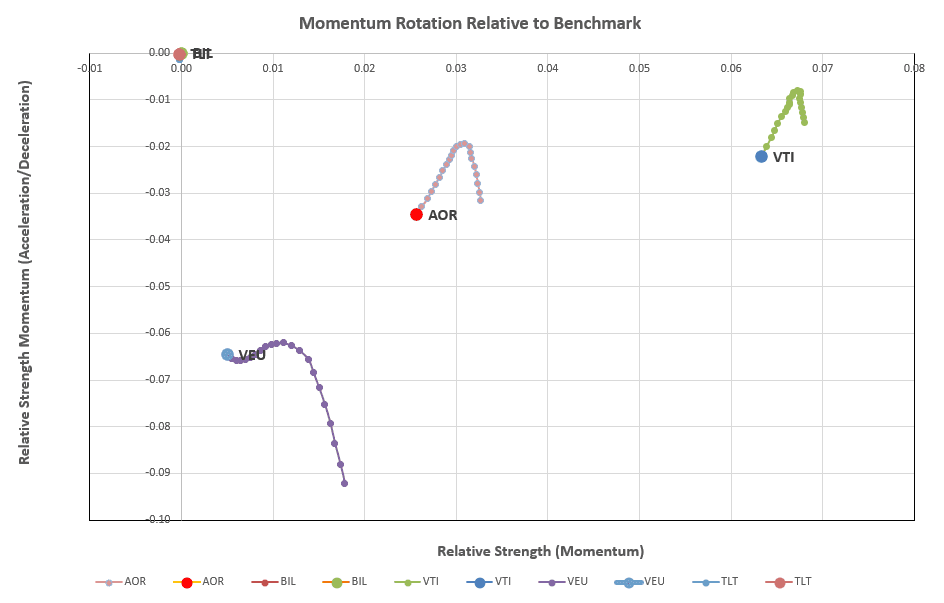
At the present time the rotation graphs for the slower moving (Kahneman) portion of the portfolio look like this:
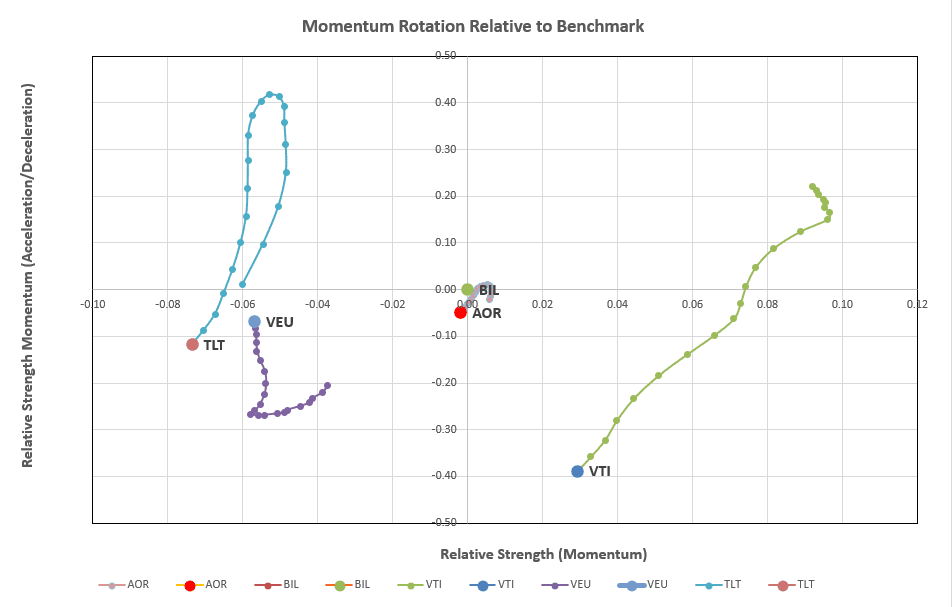
 and, for the faster moving (Tversky) portion, like this:
 with VTI (US Equities) – furthest to the right along the horizontal axis – being the recommended asset to hold in both portions of the portfolio.
I will therefore be moving to a 100% investment in VTI going forward – although, in the short term (position along the vertical axis), all assets are looking weak.
I hope this was an interesting educational post for a boring portfolio 🙂
Discover more from ITA Wealth Management
Subscribe to get the latest posts sent to your email.
Leave a Comment or Question