
Thistle sailboats racing on the Willamette River.
Kepler is similar to the Einstein in that both portfolios were managed by a similar investing model and both were switched to the Sector BPI model about the same time. Based on Bullish Percent Indicator data no sectors are oversold and all overbought sectors have long had their respective ETFs set with 3% TSLO values.
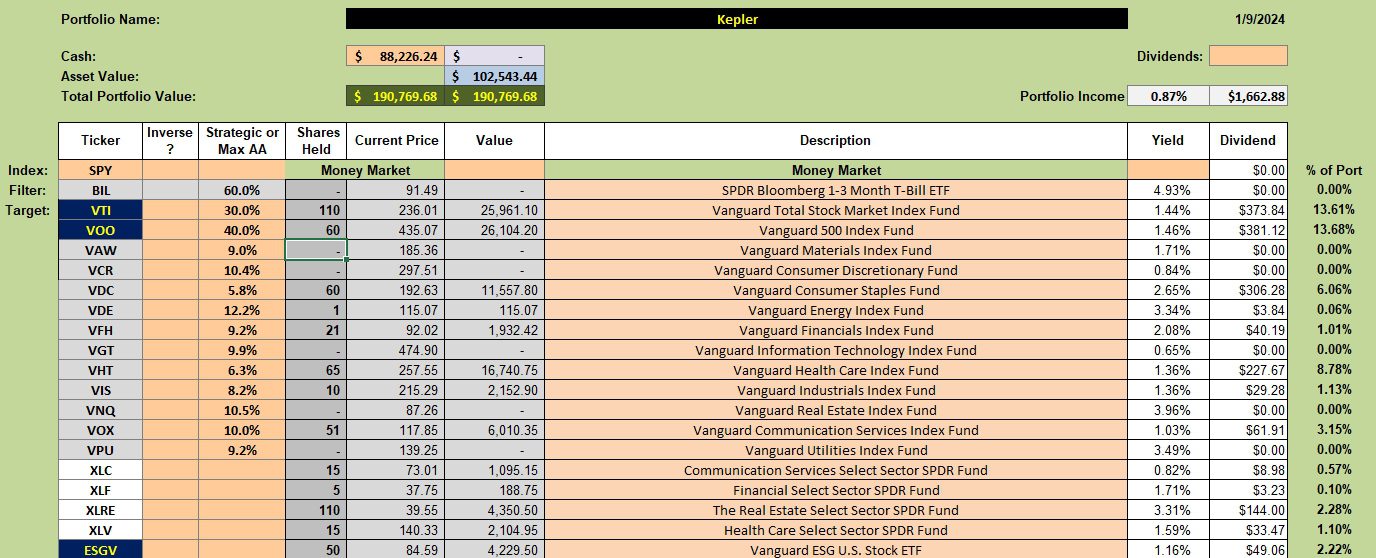
Nearly 46% of the Kepler is held in cash so decisions need to be made as to what to do with this money. A number of limit orders are in place to add U.S. Equities. VTI and ESGV are Hold recommendations so I set more limit orders to pick up shares of VOO.
Kepler Investment Quiver and Holdings
Below we find the current investment quiver and the holdings for the Kepler. The income will actually be higher than 0.87% as the Kepler derives income from cash held in a money market account.
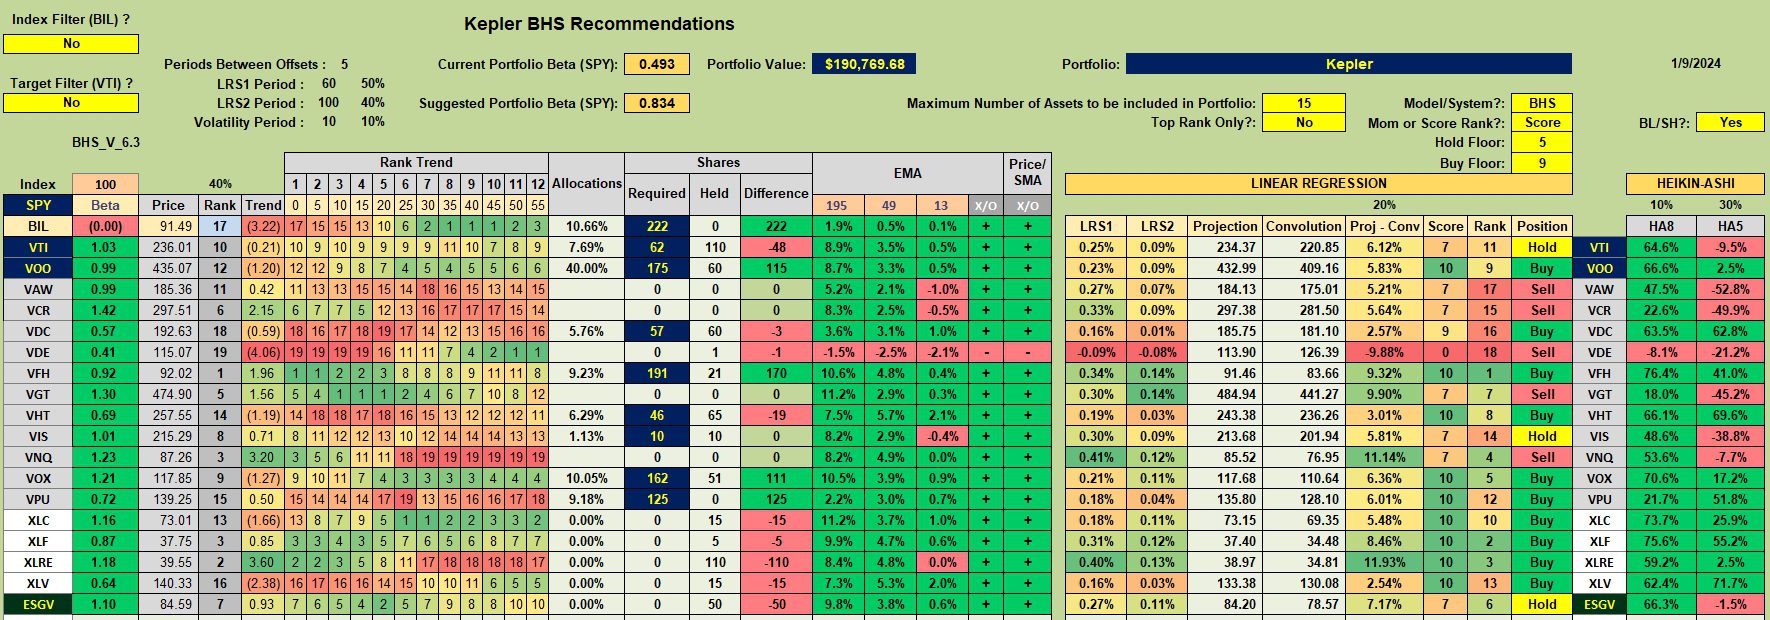
Kepler Security Recommendations
Once more we don’t use the following worksheet to manage the sector ETFs. Instead, we use this worksheet for guidance as to what to do with VTI, VOO, and ESGV. Of these three securities only VOO is a Buy. Numerous limit orders are in place to purchase more shares of VOO.
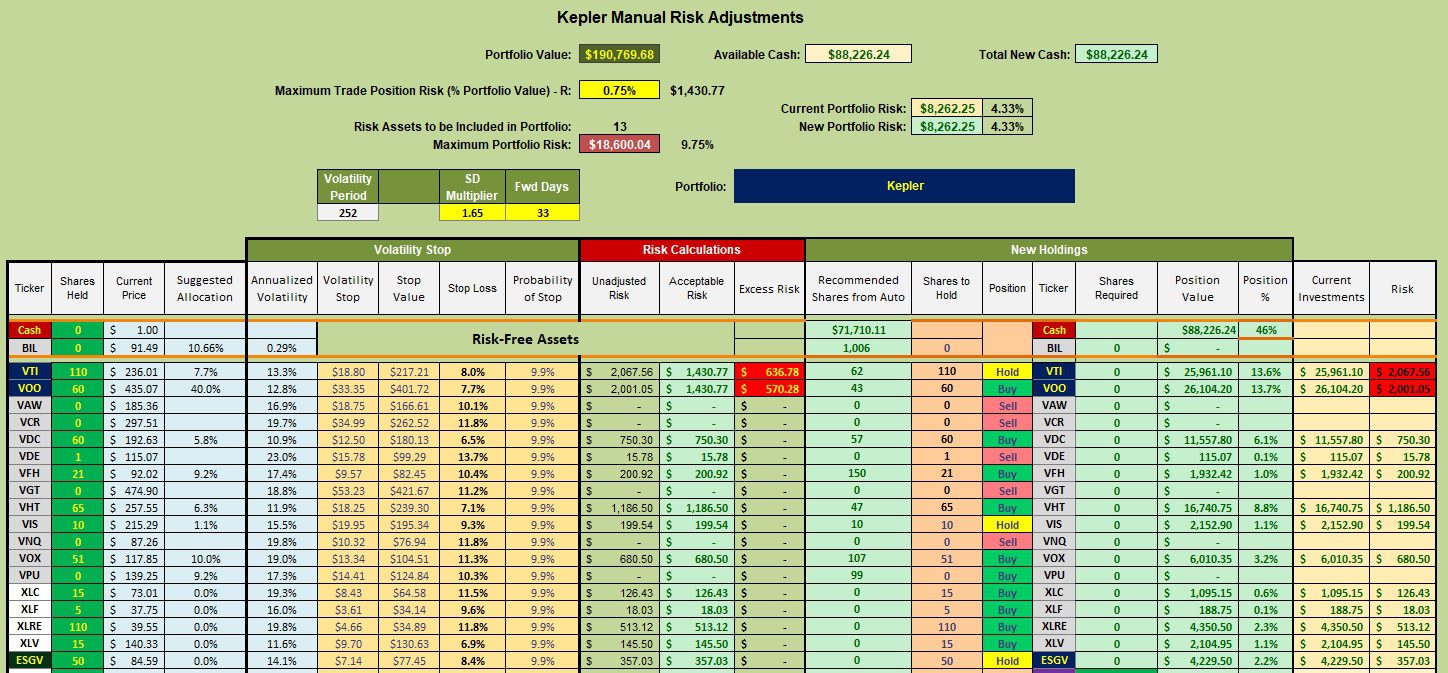
Kepler Manual Risk Adjustments
Now we come to the manual risk adjustment worksheet. I have the SD Multiplier set so the Stop Loss for VTI is 8.0%. This is one of the risk controls available within the Kipling spreadsheet.
All three U.S. Equity ETFs are oversubscribed so we need do nothing at this time. Rather than sit on this much cash I have numerous limit orders set to add shares of VOO. Limit orders are set anywhere from 1% to as low as 15% below the current price. If this market moves up from here I pay a penalty of sitting in cash rather than having it invested in the market.
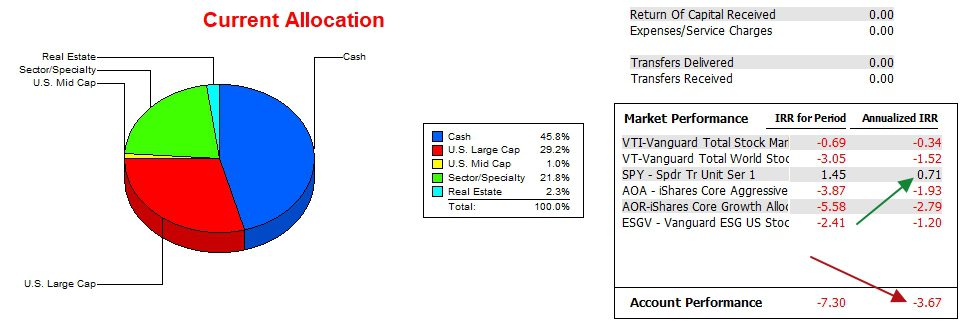
Kepler Performance Data
Over the past two years the Kepler lags the S&P 500 (SPY) by over four percentage points. The longer this gap persists the more painful it becomes. The delta is not quite so great when compared with the AOR benchmark.
Kepler Risk Ratios
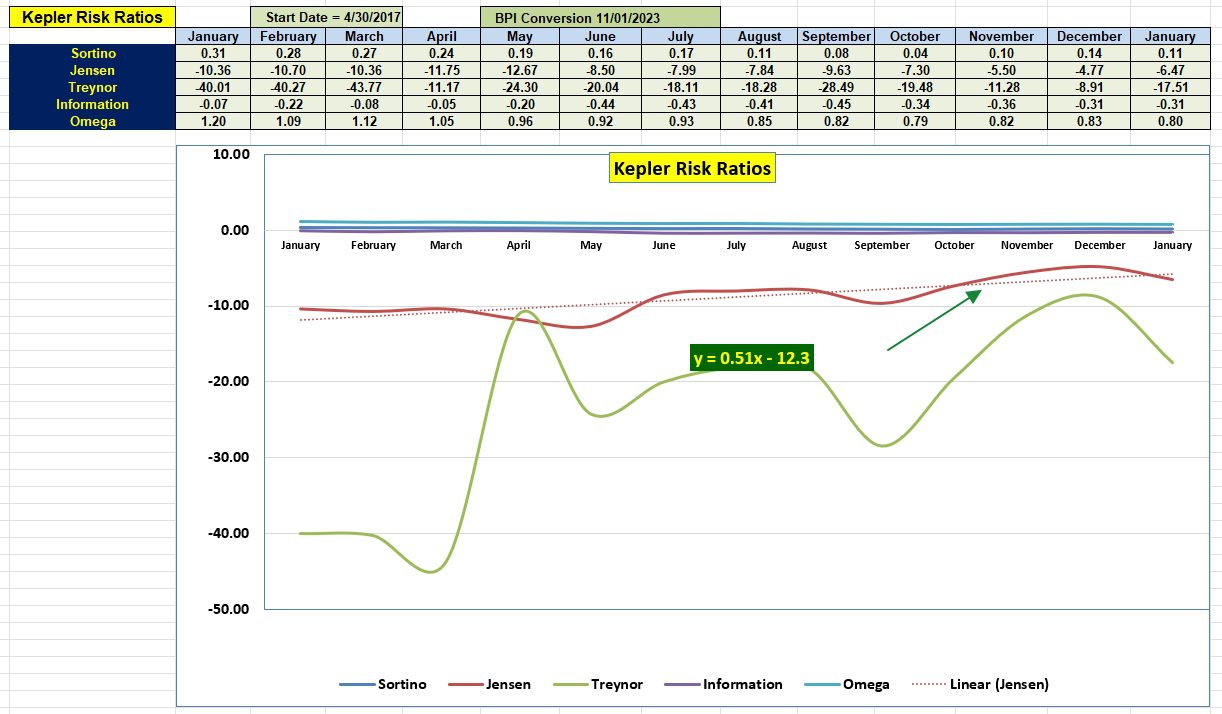
This month the slope of the Jensen flipped from negative to positive. That is the good news. The Information Ratio is holding steady indicating the Kepler is keeping pace with SPY and we see improvement since last May.
The trends of the Jensen Performance Index and Information Ratio over the next few months will be a good test for the Sector BPI investing model.
Discover more from ITA Wealth Management
Subscribe to get the latest posts sent to your email.
You must be logged in to post a comment.