
Standoff
Kepler is another portfolio that made the transition from a Relative Strength investing model over to the Sector BPI investing model in the last few months. Therefore, pay more attention to trends rather than the absolute performance results. This also applies to other portfolios that are in the process of making the transitions to the Sector BPI model.
We need a few Buy and Sell cycles to give the hypothesis of the Sector BPI model a real test. Thus far the results are quite promising. Once 2023 ends I’ll be posting explicit data on the results going back to when I first launched the Sector BPI model with the Carson portfolio.
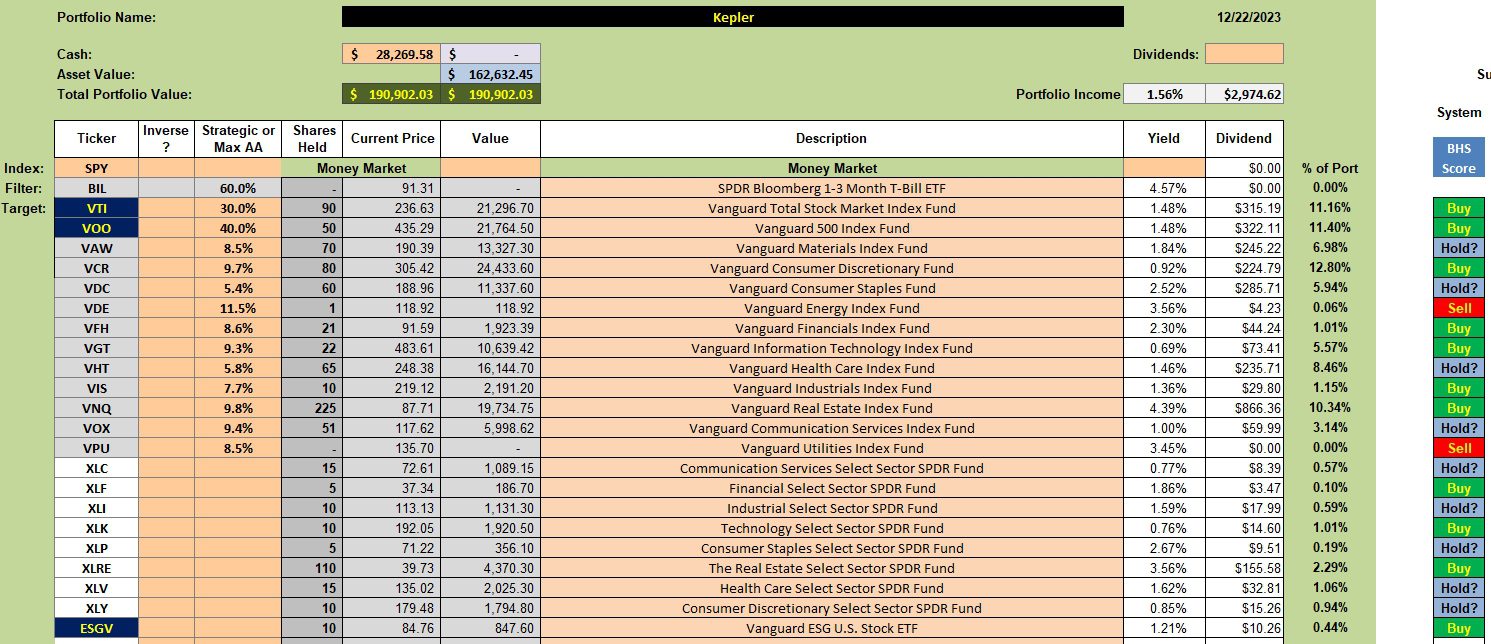
Kepler Investment Quiver and Holdings
Below is the investment quiver and holdings in the Kepler. I made the error of purchasing ETFs (tickers beginning with X) thinking they were equal-weighted ETFs. I will correct this error as I have TSLOs set to sell all the SPDR ETFs. If the market continues to rise it may be months before the Kepler is “free” of these ETFs. At least they are not doing any harm to the portfolio in this bull market.
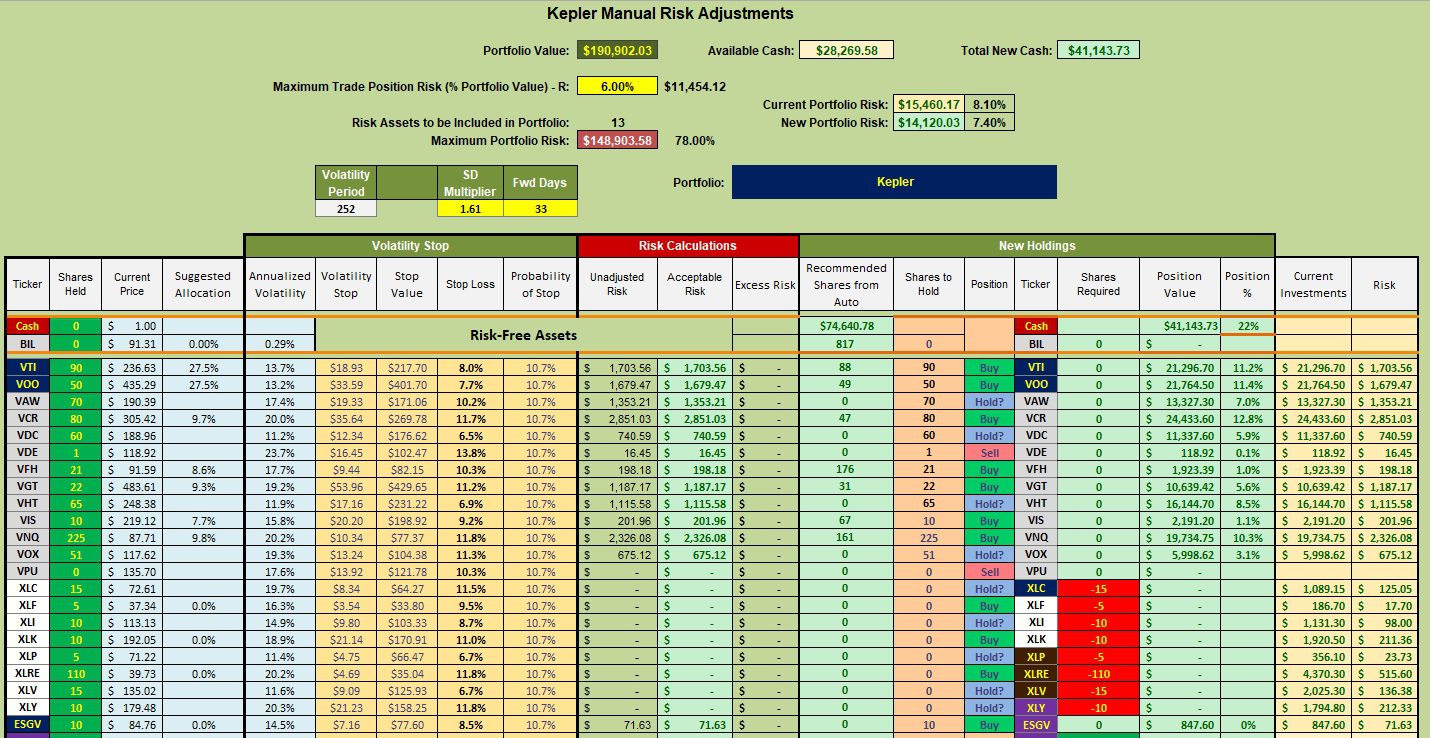
Kepler Manual Risk Adjustments
No sectors are the Buy zone so I am not adding to the current positions of any of the sector ETFs. Note that I plan to sell off the SDPR ETFs or those tickers that begin with an X. VOO, VTI, and ESGV are fully populated or over-subscribed. There is no call to add shares to these three U.S. Equity ETFs. I have a few limit orders in to add more shares of VOO and ESGV, but the limit prices are set so low I doubt the orders will be struck. By low I’m talking 10% to 15% below the current price.
At this point I plan to sit on a large amount of cash and wait for the next sector Buy orders to emerge. It might be months before any of the sectors drop below the 30% bullish line.
If there are questions as to what oversold and overbought zones are all about, drop a question in the Comment section provided below.
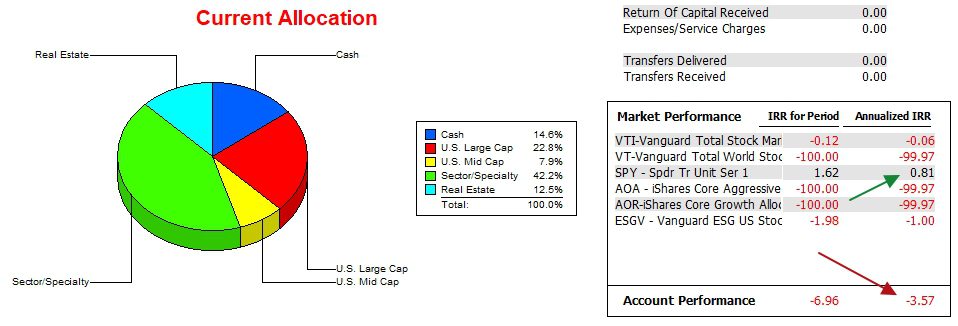
Kepler Performance Data
Over the past two years the Kepler has been lagging the SPY benchmark. The delta is now over 4 percentage points annualized. We need to look to the Risk Ratio table to see if the gap is closing or growing wider.
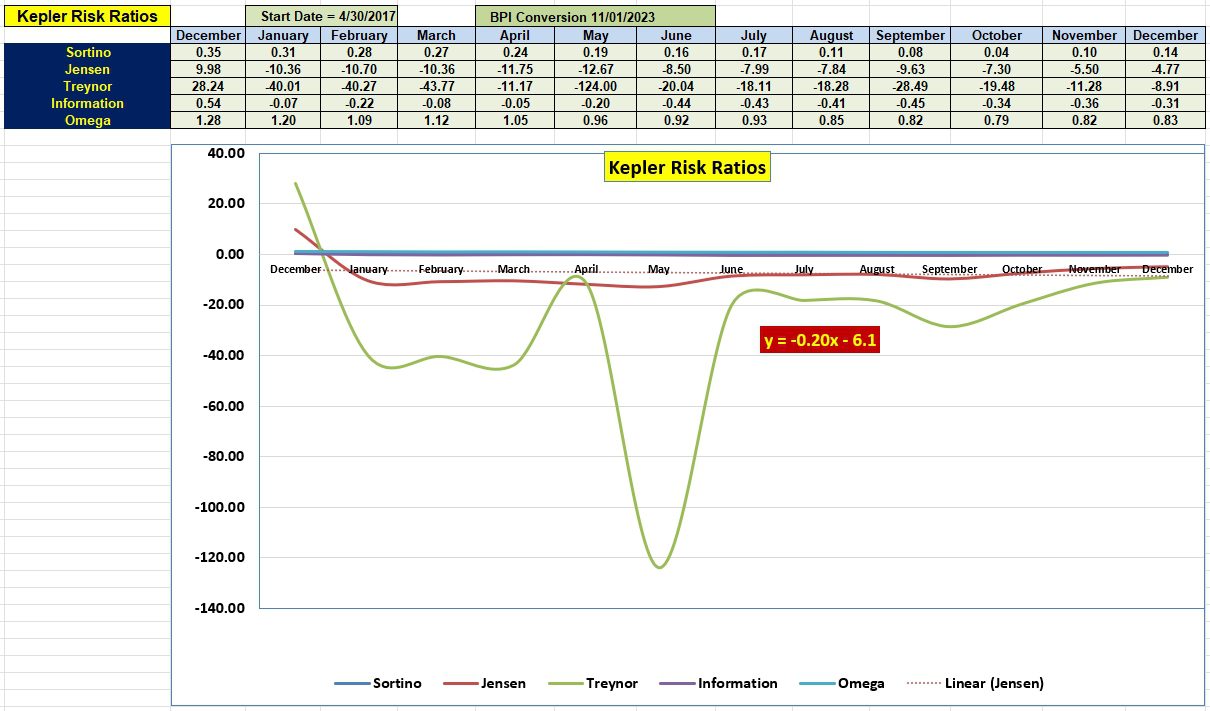
Kepler Risk Ratios
The Information Ratio is the best indicator to see if the gap between the Kepler and SPY is decreasing or increasing. The good news is that since last May the delta or gap is closing. Kepler, under the Sector BPI model, is gaining slightly on the SPY (S&P 500) benchmark.
When risk is taken into account we look to the Jensen Alpha Ratio. The Jensen Alpha is also called the Jensen Performance Index. Once we clear the December 2022 value the slope of the Jensen should come close to flipping from negative to positive. We will have that information shortly or when the Kepler is next reviewed. Over the last few months the trend is in the right direction, despite the rise in the risk-free short-term interest rate.
If this investment information is useful, pass the ITA link on to your friends and family.
Millikan Sector BPI Update: 20 July 2023
Tweaking Sector BPI Plus Investing Model: Part II
Discover more from ITA Wealth Management
Subscribe to get the latest posts sent to your email.
You must be logged in to post a comment.