
Iris from Schreiner’s Gardens
While this review of the Copernicus portfolio occurs in June, the data more appropriately belongs to May. Take that into consideration as you read this update. As followers of this portfolio know, this is a passive portfolio that focuses on investing only in U.S. Equities and is limited to large-cap stocks that track the S&P 500. Other than the Schrodinger, the Copernicus is one of the easiest portfolios to manage. All one does is save and purchase shares in ETFs such as VOO. Why VOO? The expense ratio is low (3 basis points) and it is extremely difficult to consistently outperform the S&P 500 year in and year out.
Another significant advantage to this portfolio is that it is tax efficient as trades are rare. I am a fan of simplicity and the Copernicus embodies this management style.
Recent purchases in SHV is a deviation from investing only in equities. Why the change? The majority of economists I listened to are projecting the tariffs will hit in the third and fourth quarters. Will the administration listen to the courts and back off the tariff war? That is just another uncertainty factor, something the stock market does not like. The current purchases of SHV is a hedge against the potential decline in equities later this year as the supply chains have already experienced damage.
Copernicus Security Holdings
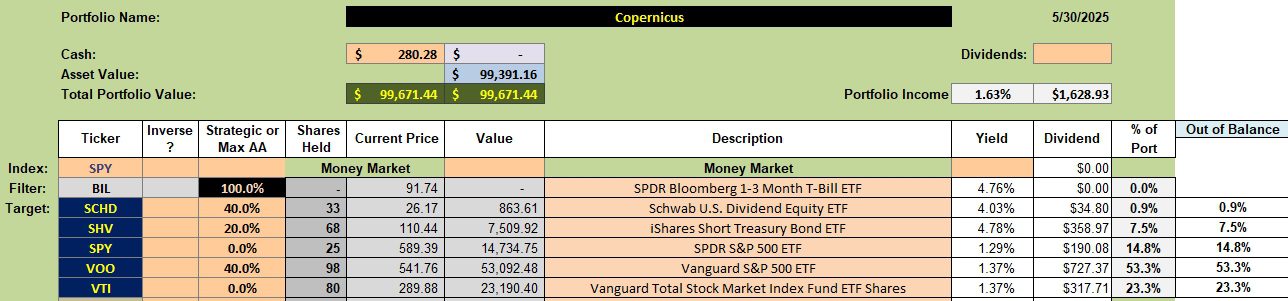
Below are the current holdings for the Copernicus. Shares of ESGV hit their TSLO limit and were sold. I have TSLOs set for SPY and VTI, but not VOO. Should the market decline I will purchase more shares of VOO using new cash and sell shares of SHV to raise more cash.
Copernicus Performance Data
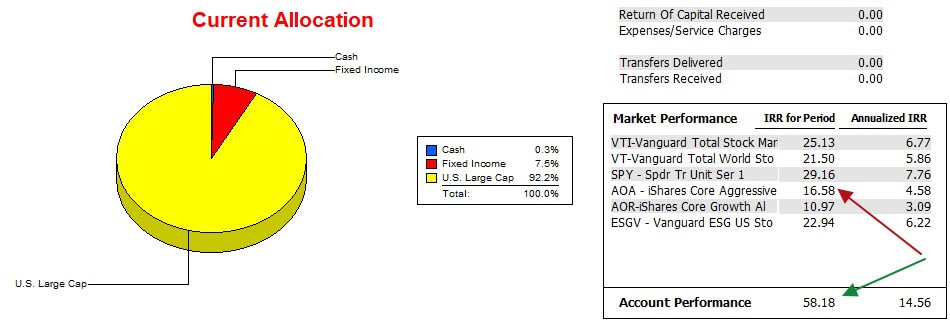
Since 12/31/2021 the Copernicus has outperformed all six benchmarks tracked here at ITA. The race is not even close at this point.
Copernicus Risk Ratios
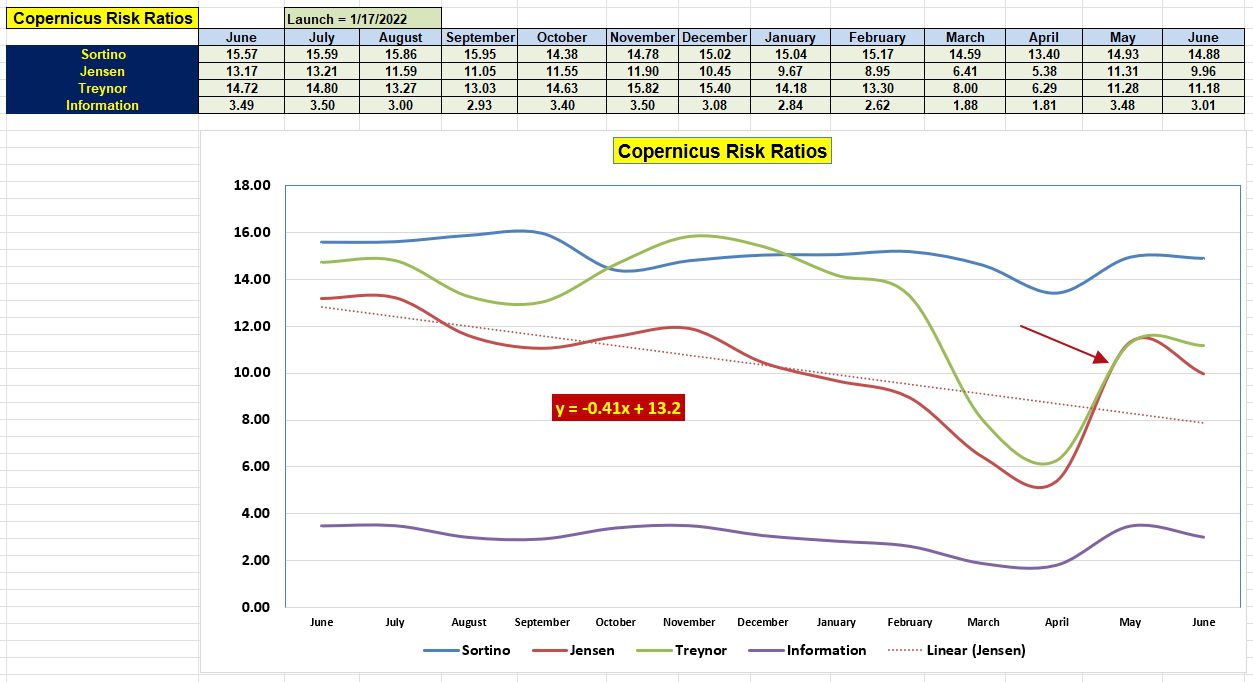
While the Copernicus is crushing all benchmarks based on Internal Rate of Return (IRR) calculations, the data is not as positive when it comes to measuring the Jensen Performance Index or Jensen Alpha. The Jensen Ratio is in steady decline as it is extremely difficult to maintain such a high level. Anything above zero is considered to be excellent.
Once we reach 2026 the slope will not look quite so miserable. Overall, the Copernicus is performing very well.
Buffett Indicator & Shiller PE Ratio
Discover more from ITA Wealth Management
Subscribe to get the latest posts sent to your email.
Leave a Comment or Question