
Scottish Highlands
US Equities hit more new all-time highs again this week as the SPX (S&P 500 Index) closed up ~1.6% from last week’s close:
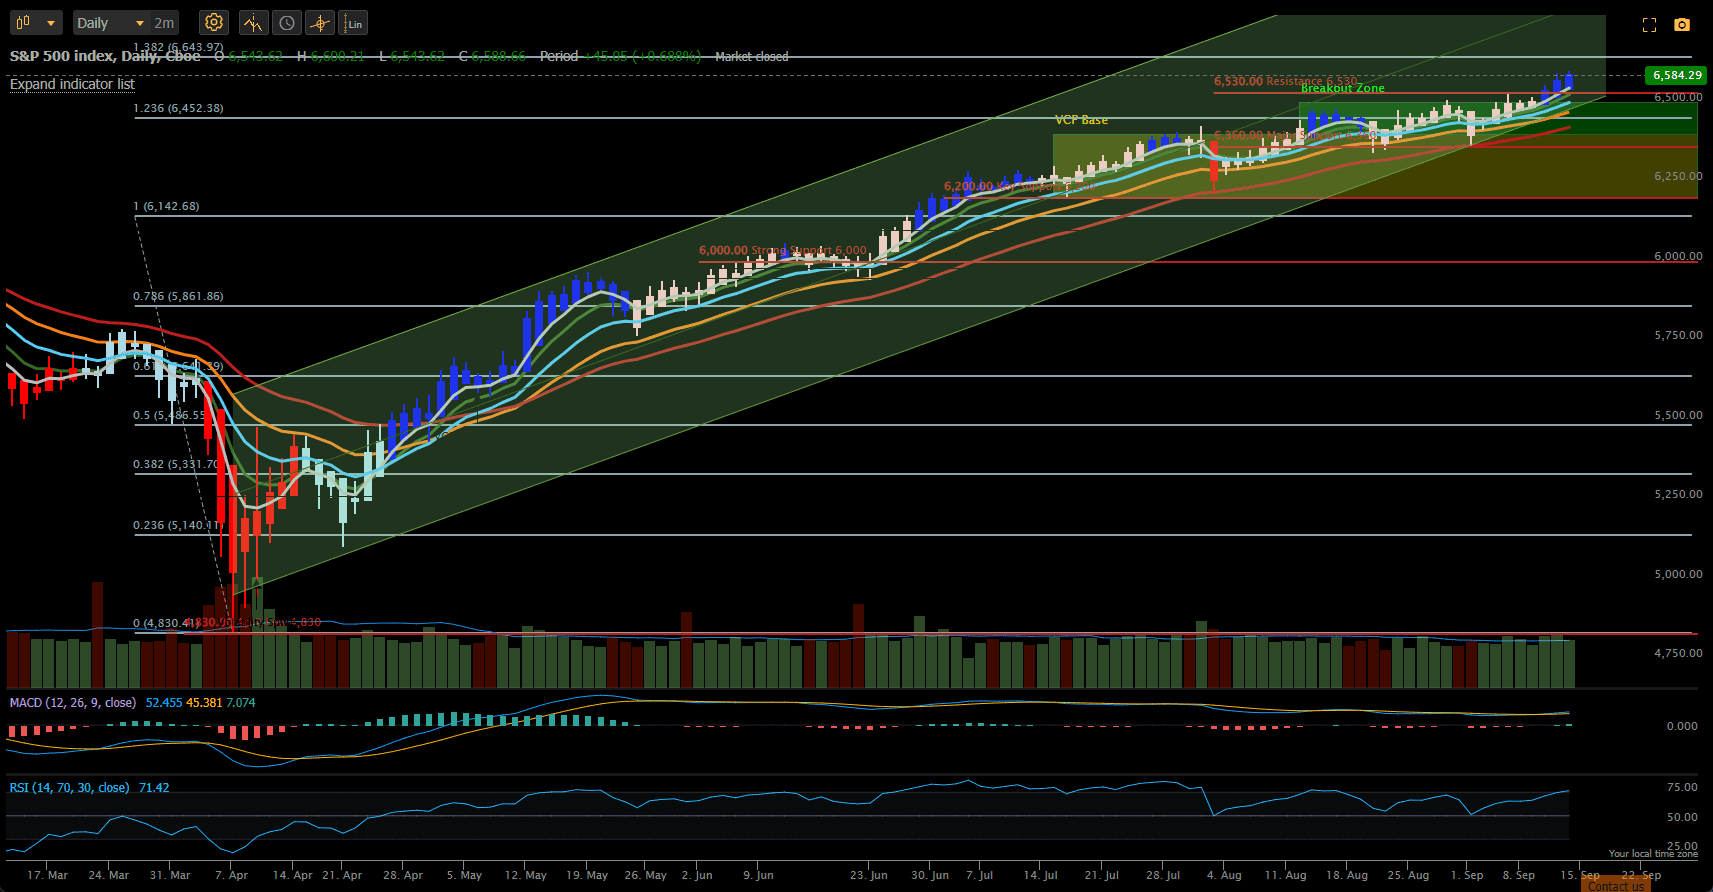
The next potential resistance level is likely in the 6600-6650 area but, to date, we have not seen evidence for another September of poor performance – certainly no significant pullback at this point. It will be interesting to see whether the last major resistance level at ~6450 acts as support going forward. Note the EMA (Exponential Moving Average) lines in the above figure – these ar at the 5-, 8-,13-, 21 and 34 period levels – more about this later when we take a look at the rotation model towards which I am presently in the process of migrating towards.
It was a strong week for all major asset classes:
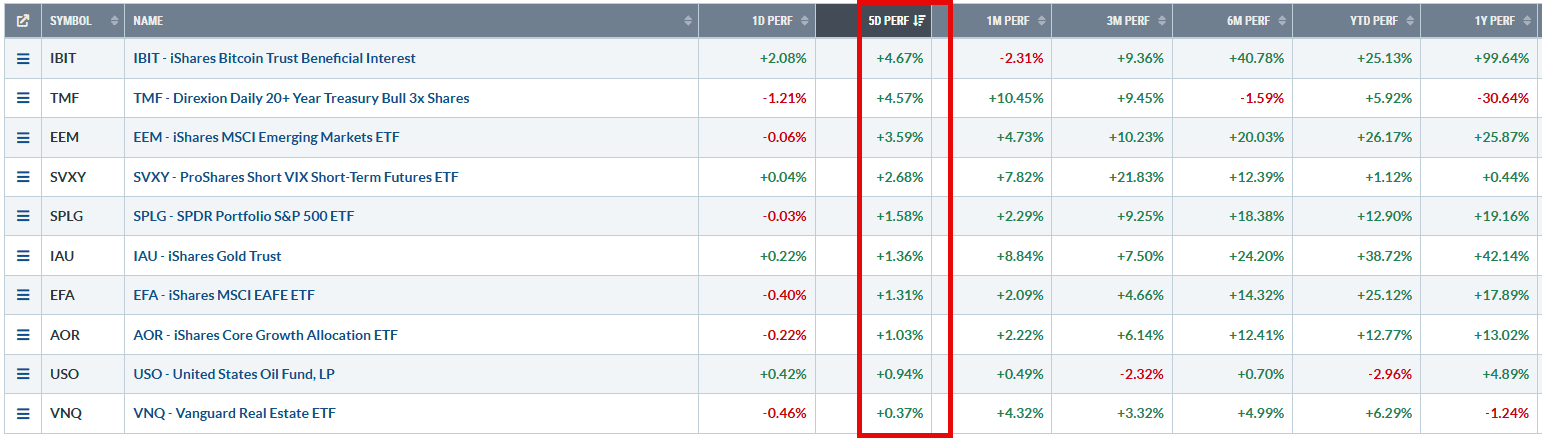 led by Crypto and with equities, generally, in the middle of the pack. Last week’s new additions to the portfolio IAU (Gold) and TMF (Bonds) both came through in the top half of the contenders.
Performance to date (~4 months since inception of the portfolio looks like this:
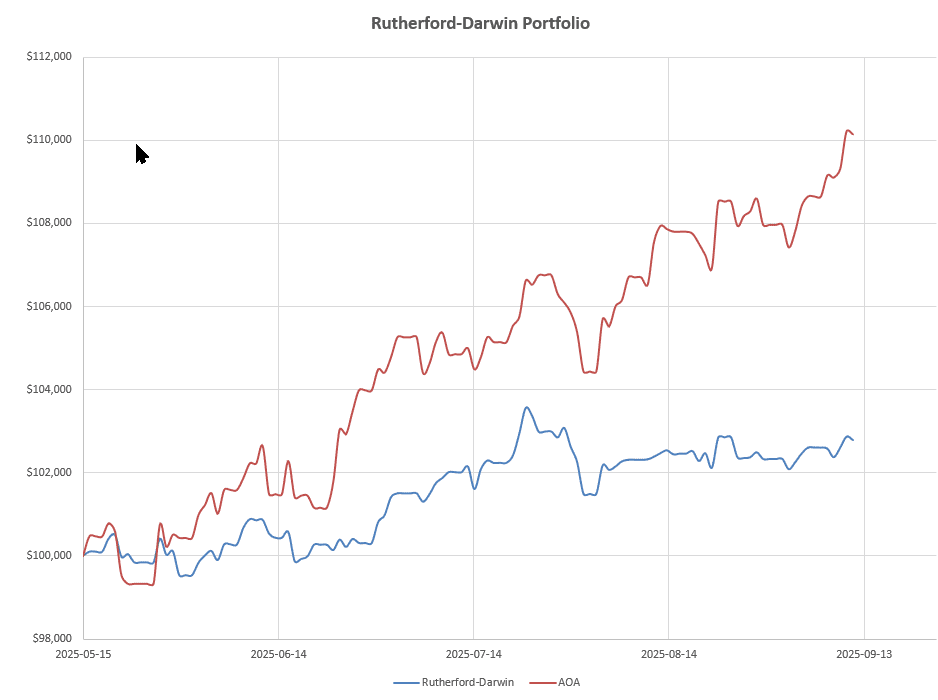 with an annualized 8.7% Internal Rate of Return (IRR) at very low 4.5% volatility (risk). However, this is maybe a little too cautious since a lot of potential return has been given up through conservatism and risk hedging. The portfolio has only been ~50% invested and over-hedged (too cautious). As we can see from the above figure, volatility is very low but this is certainly at the expense of returns. I plan to be more aggressive from here as I move towards the new, revised, rotation system.
Checking the original BHS system, that was used to start this portfolio, we see the following rankings and recommendations:
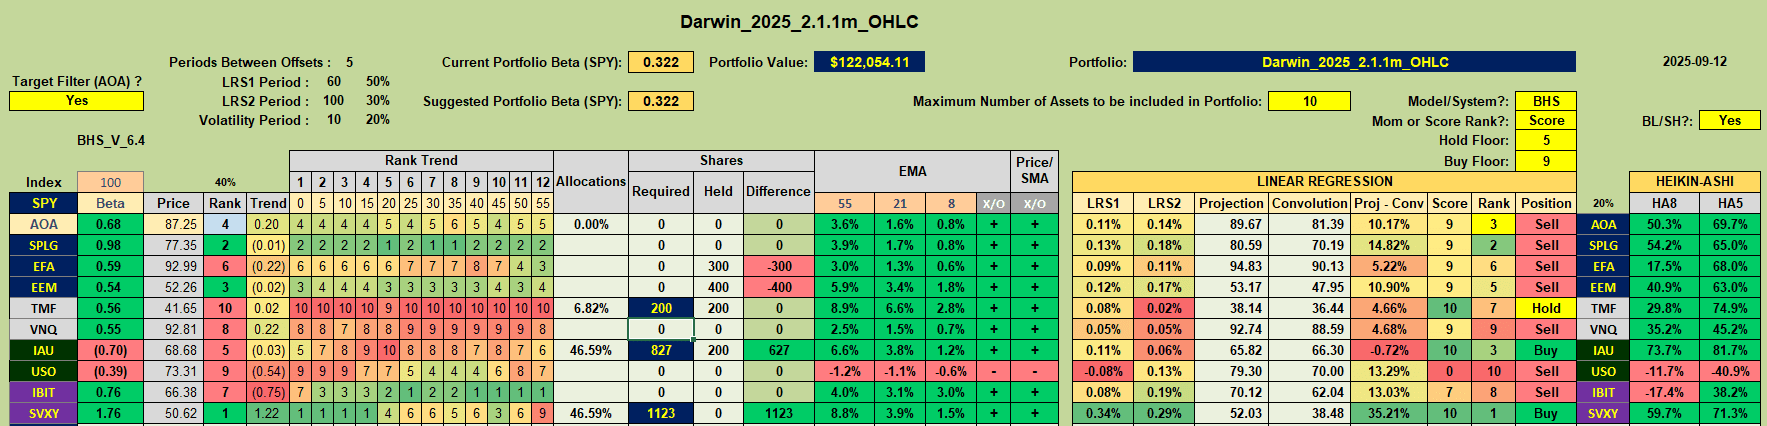 While last week’s additions (IAU and TMF) remain as recommended Buy’s and Hold’s respectively, EEM and EFA (Emerging Market and Developed Market Equities) have dropped into the Sell recommendation list. However, if we look at the new rotation system workbook we see the following picture:
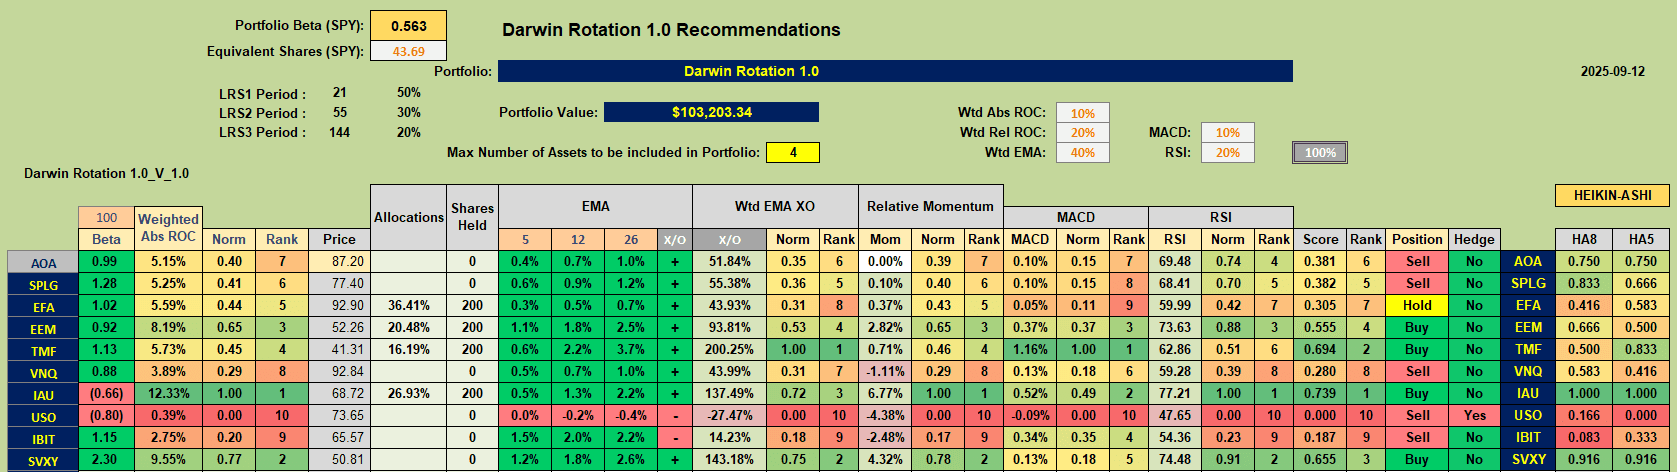 where EEM and EFA remain in the Buy/Hold categories.
The main change between the systems is the deliberate inclusion of Moving Average crossovers in the selection algorithm. In the center columns of the above screenshot (Wtd EMA XO) we see a measure of “Trend” strength calculated by weighting the separation between 5 moving averages (5-, 8-, 12-, 26- and 34-period EMAs) – 10 combinations in all.
Inputs in the MENU sheet look like this:
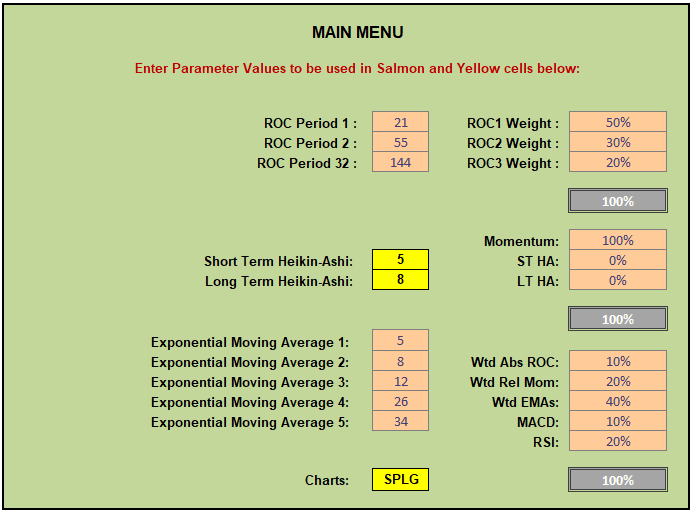 I would have set EMA 3 and EMA 4 at 13- and 21- day periods (as in the price chart above) simply because I am obsessed with Fibonacci numbers – but, since I needed 12- and 26- period EMA values for “standard” MACD calculations I chose to keep the number of workbook sheets to a minimum by using values from the 2 sheets for both calculations. A system should not be that sensitive to parameter settings (within reason) that this makes any significant difference. Weightings for the EMAs range from ~18% for the fastest changing (5-period to 8-period) crossover pair to ~2% for the slowest changing (26- to 34-period) pair.
In the rankings/recommendations worksheet the assets are ranked (3rd column for each parameter/feature) based on the normalized position (middle column) within the 100-day maximum/minimum range of calculated values i.e. all normalized values lie within a 0 to 1 range for each feature (EMA crossover, Weighted Rate of Change (ROC), Relative Momentum (ROC), MACD and RSI. Note that I have moved to 3 look-back periods 21-, 55-, and 144- (Fibonacci) to measure “Absolute Momentum” weighted 50/30/20, but have reverted to a Rate-Of-Change (ROC) measurement, rather than a Linear Regression measurement – again, simply because it is simpler and keeps the number of worksheets within the workbook a little easier to check and keep straight. “Relative Momentum” is a similar calculation but based on the asset/benchmark ratio. At the present time there is no difference in rankings between these 2 “momentum” calculations – if there were differences they would be weighted in a 2:1 ratio between relative and absolute values.
The above “Trend” and “Momentum” signals, together with the faster MACD and RSI “momentum” signals are combined and weighted as identified in the above MENU screenshot. I have retained Heiken-Ashi values in the Tranche worksheet but (at present) have left these out of the final classification calculations since the MACD and RSI indicators provide similar (fast, short-term) information. The MACD and RSI indicators are also used as indicators to suggest whether an asset should/might be hedged. To this point I have been hedging when either one of these two indicators signaled bearishness – but this seems to be too cautious and lead to over-hedging, so I will be looking for confirmatory bearish signals from both indicators to possibly sell Calls in the future.
Moving towards the new system I have made the following adjustments in the last week:
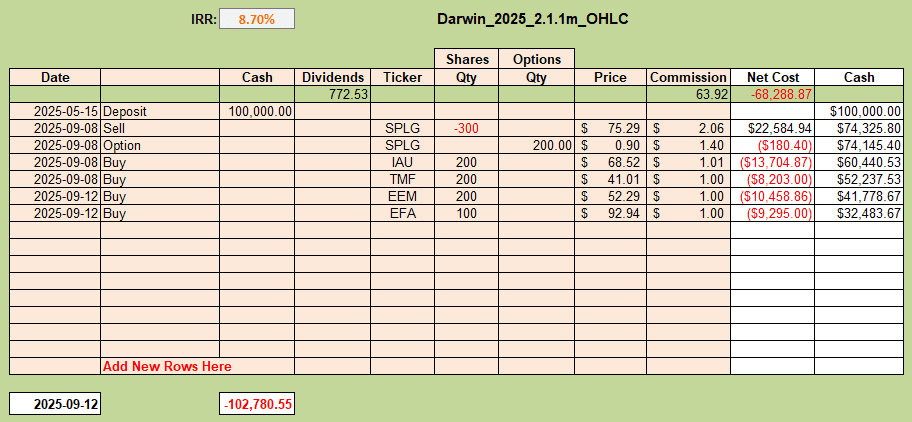 Having sold my position in SPLG and bought positions in IAU and TMF last week I have added more shares in EEM and EFA this week so as to increase my total portfolio investment. I am still using a targeted volatility level of 2% to calculate allocations but am using a total value of double the actual funds available ($200,00) to calculate the number of shares to buy. I could probably have simply changed the volatility level but, since I now have experience to show that only ~50% of funds are normally invested (with 4 or 5 assets being held at any one time) it was easier to just double the numbers. Current holdings represent a ~70% investment of available funds.
The parameter values that I have chosen to use are based solely on my past experience and there has been no attempt at “optimization”. However, when I have collected sufficient data, I will likely take a closer look to see if one or more settings is causing over or under trading. At present it looks as though there might be too much whipsawing and that I might have to look for a way to filter this out – but more information/data is needed before I can do this.
Discover more from ITA Wealth Management
Subscribe to get the latest posts sent to your email.
Leave a Comment or Question