
Arches National Park
The McClintock portfolio was last reviewed on April 29th so it is long overdue. Numerous sector ETFs were sold out of the McClintock since the last review so I will be examining how well the Sector BPI investing model is working by analyzing the last screenshot in this blog post.
McClintock Security Holdings
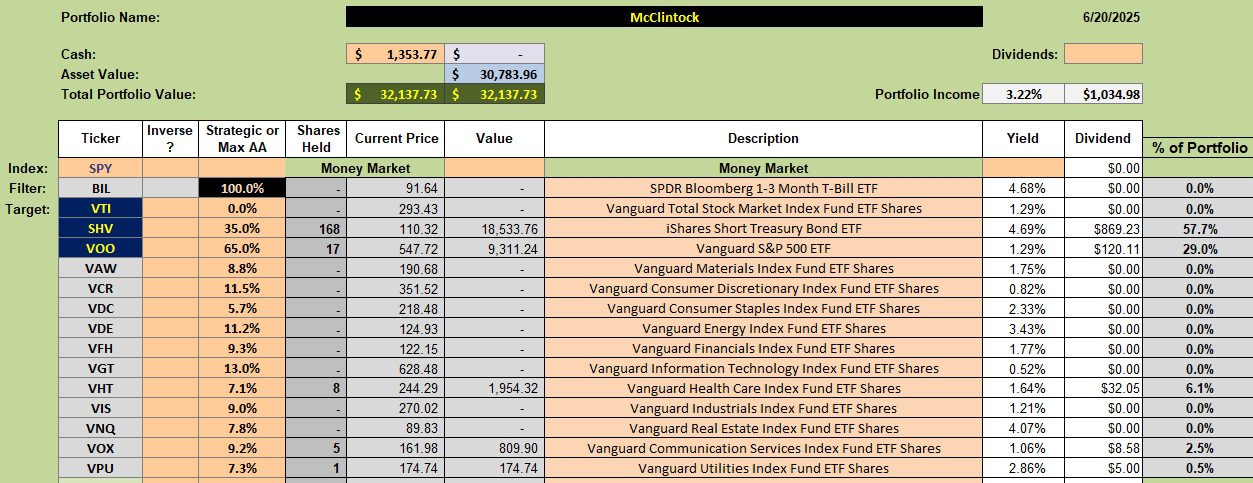
Below are the current holdings in the McClintock. No sectors are oversold and the sector ETFs included in the McClintock are not overbought. So we patiently wait for further Buy or Sell signals.
Available cash is reinvested in SHV as a risk-free option in this uncertain political environment.
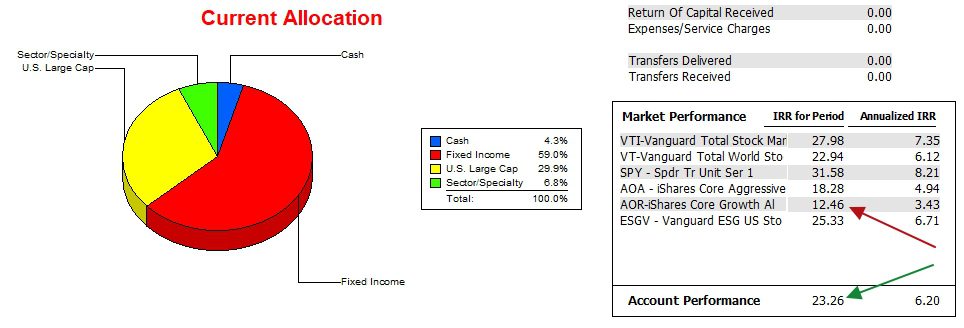
McClintock Performance Data
Since 12/31/2021 the McClintock has far outpaced the AOR and AOA benchmarks, but fallen short of several other equity oriented benchmarks. Note how well SPY has performed.
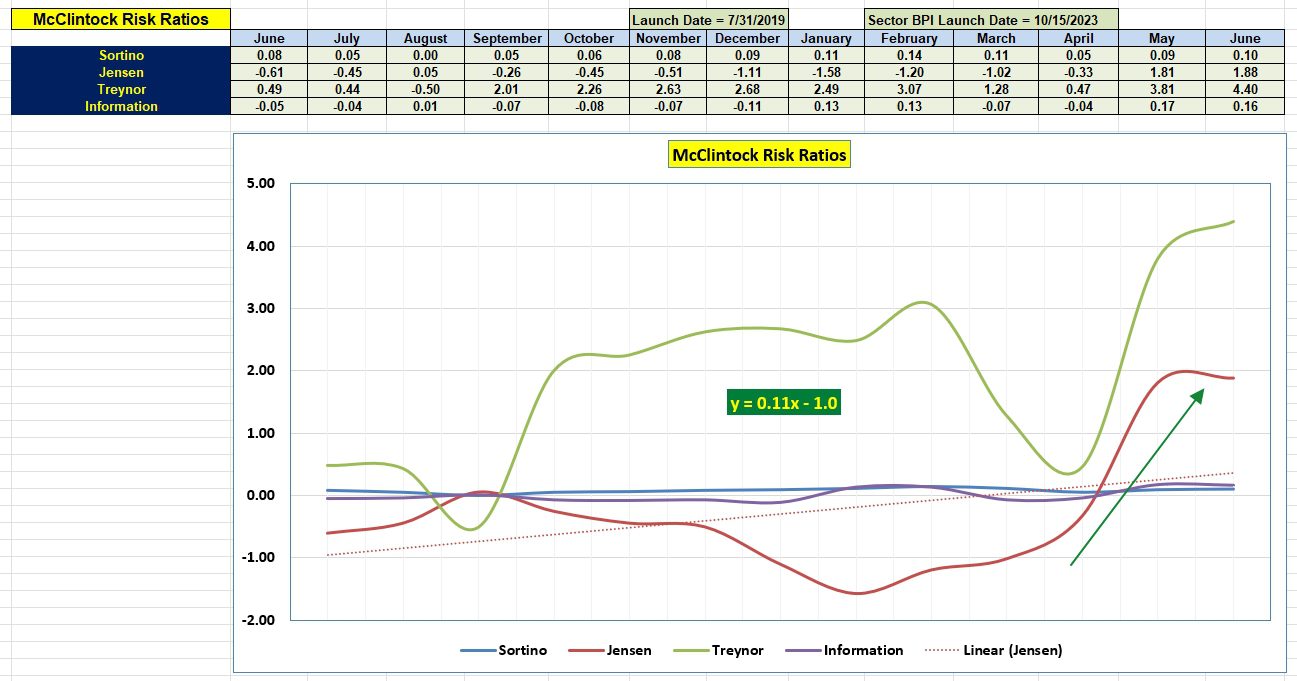
McClintock Risk Ratios
All risk ratios are well above where they were a year ago. The goal is to maintain this level of performance.
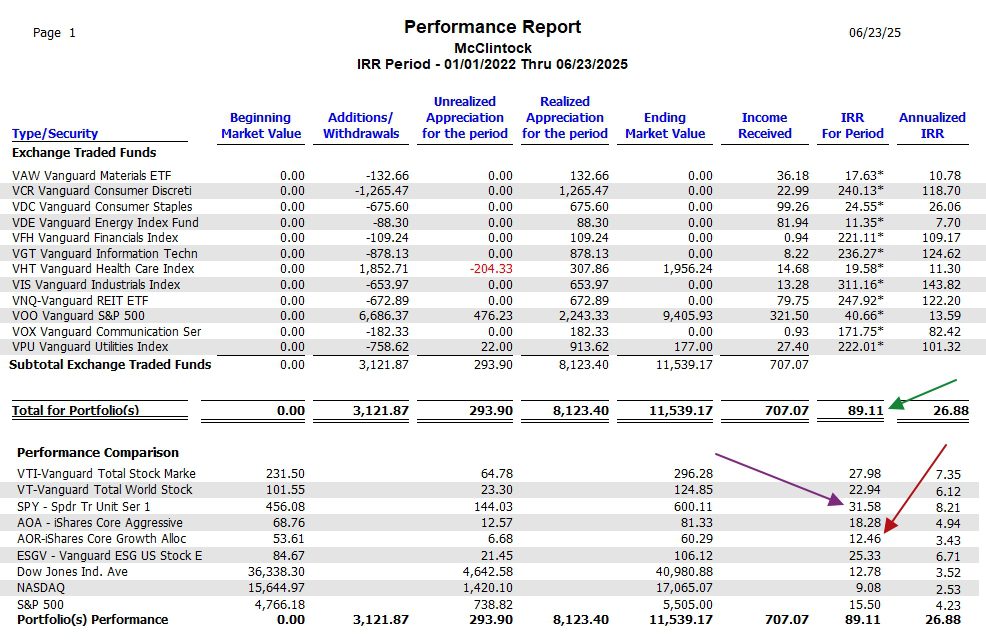
Sector Performance Data
The following data table needs some explanation as it is not a complete record of the McClintock portfolio performance. Instead, the table shows how well the different sectors (plus VOO) performed while held in the portfolio. The asterisk adjacent to the IRR For Period percentage indicates the security was not held over the entire period under investigation. Cash is not included in the following data. SHV data is not included.
What the table does show is that purchasing sector ETFs when the sector is 30% bullish or lower and then selling or placing TSLOs when the BPI sectors reach 70% or above is a winning concept. The Sector BPI investing model is working as hypothesized.
Disregard the DJIA, NASDAQ, and S&P 500 information as it is not current. I forgot to delete that data.
Discover more from ITA Wealth Management
Subscribe to get the latest posts sent to your email.
Leave a Comment or Question