
West Linn paper mill to be removed over the next 20 years by multiple Indian nations. It cannot happen too soon.
One of the younger Sector BPI portfolios is the McClintock. In operation a tad over seven (7) months or barely sufficient time to make any kind of evaluation as to the viability of this investing model we are looking for trends rather than current values. For most of this short period we have been in a bull market. While not wishing for a bear market, we need to experience a significant one in order to test the Sector BPI investing approach.
If the Sector BPI investment model seems to complicated, check out the Schrodinger and Copernicus portfolios. The Schrodinger requires no investing knowledge or work. The Copernicus is nearly as simple to manage.
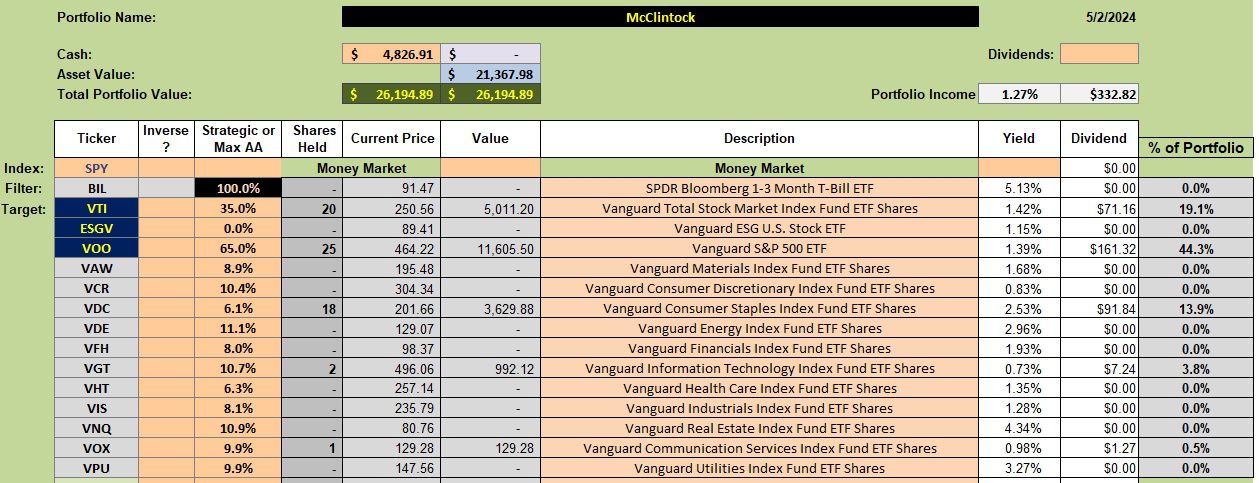
McClintock Security Holdings
As a reader examining a typical Sector BPI investment quiver as shown below, break the portfolio into two parts. U.S. Equities (VTI, ESGV, and VOO) form one part. Currently, I am using only VTI and VOO for investing when there are zero sectors in the oversold zone. Shares of Consumer Staples (VDC) were purchased many months ago when this sector dropped into the oversold zone.
The second part of the portfolio are the eleven (11) sectors. The ETFs used for these eleven sectors are VAW down through VPU. When a sector drops into the oversold zone based on Bullish Percent Indicator data, it takes priority. If insufficient cash is available to bring the sector up to the required percentage we sell shares of either VTI or VOO in order to populate the oversold sector.
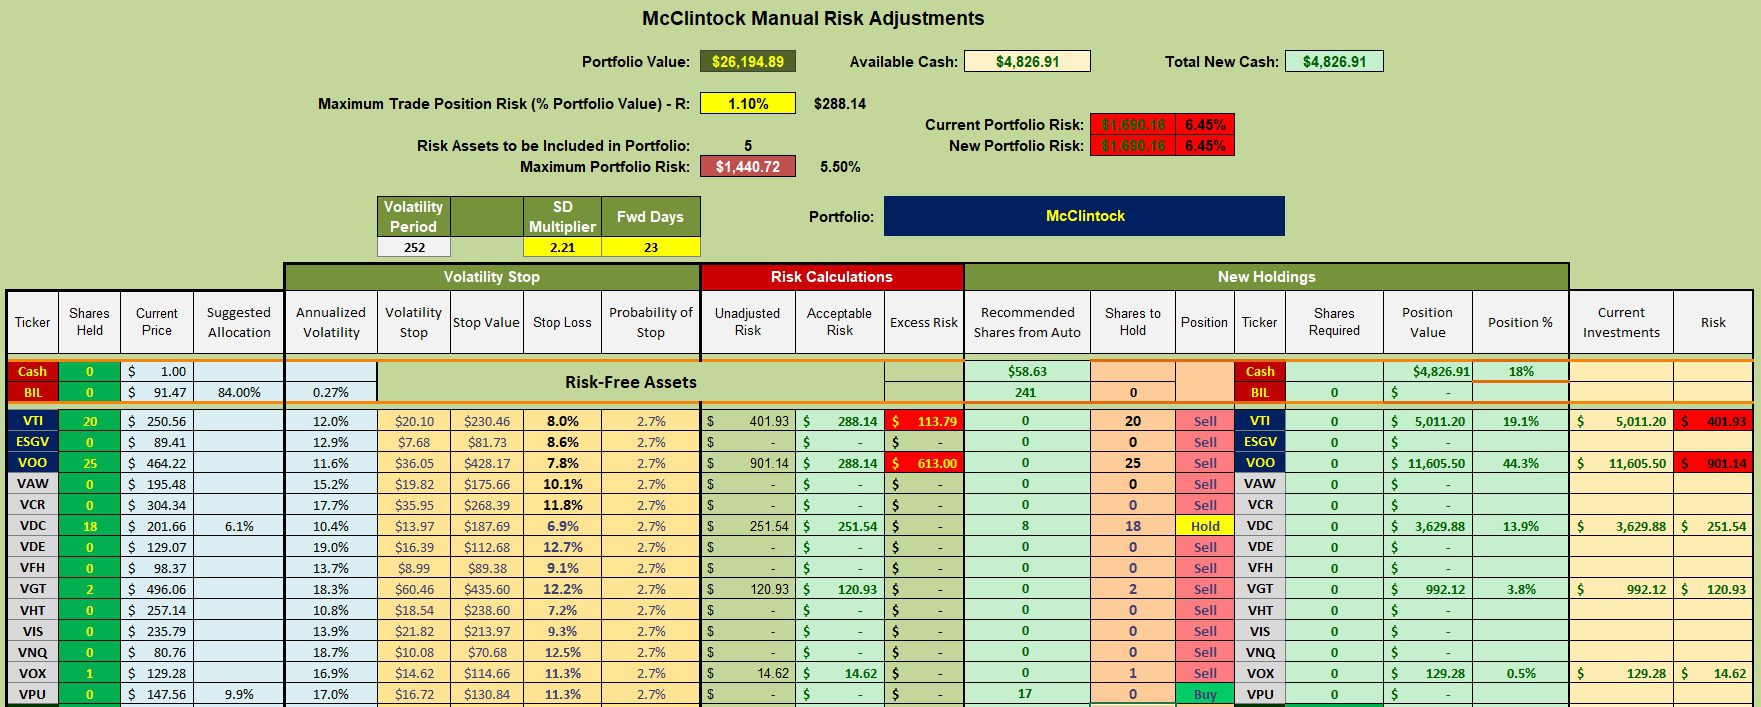
McClintock Manual Risk Adjustments
The following Manual Risk Adjustment worksheet comes directly from the Kipling spreadsheet. With the McClintock I am using the Buy-Hold-Sell system and the default look-back periods of 60- and 100- trading days. Based on the BHS system no U.S. Equities are recommended for purchase. Neither are any sectors oversold. What to do with the $4,800 in cash?
I set three limit orders to pick up a few shares of VOO at 3%, 5%, and 8% below the current price. The goal for the McClintock is to outperform the S&P 500 or more specifically, the SPY. SPY is the benchmark for the McClintock.
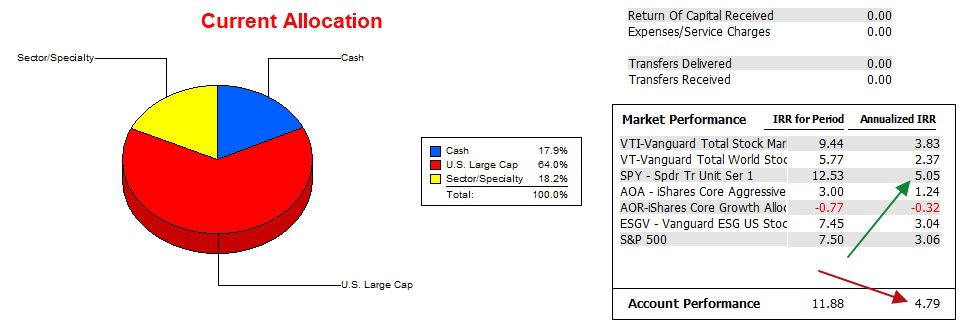
McClintock Performance Data
The following data runs from 12/31/2021 through 5/23/2024 or nearly 2.5 years. Over that period the McClintock has outperformed the S&P 500, but falls short of the SPY ETF. Compared to the other potential benchmarks the McClintock is a success. If the Sector BPI investing model works as expected the McClintock should surpass the SPY benchmark in a year or two.
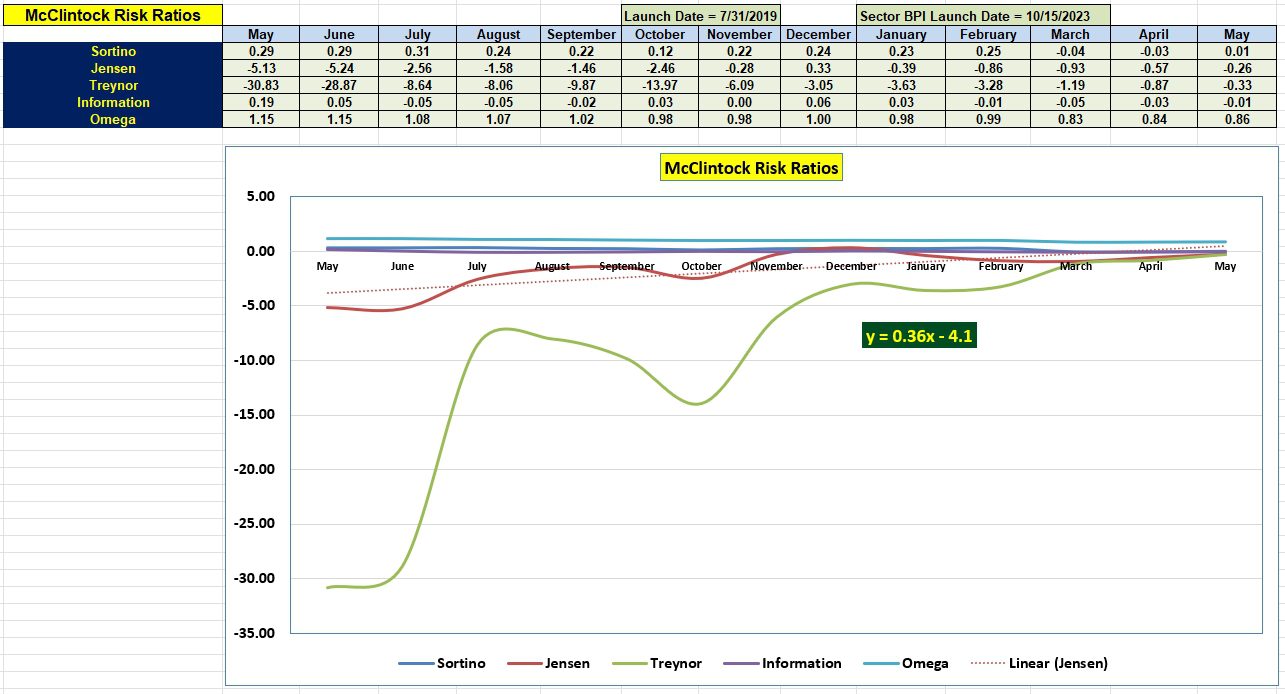
McClintock Risk Ratios
As we see from the Information Ratio, the McClintock falls just short of the SPY benchmark. The Jensen Performance Index shows some improvement since April and the slope (0.36) of the Jensen is positive.
Overall, the McClintock is performing about as well as expected.
McClintock Sector Performance Report
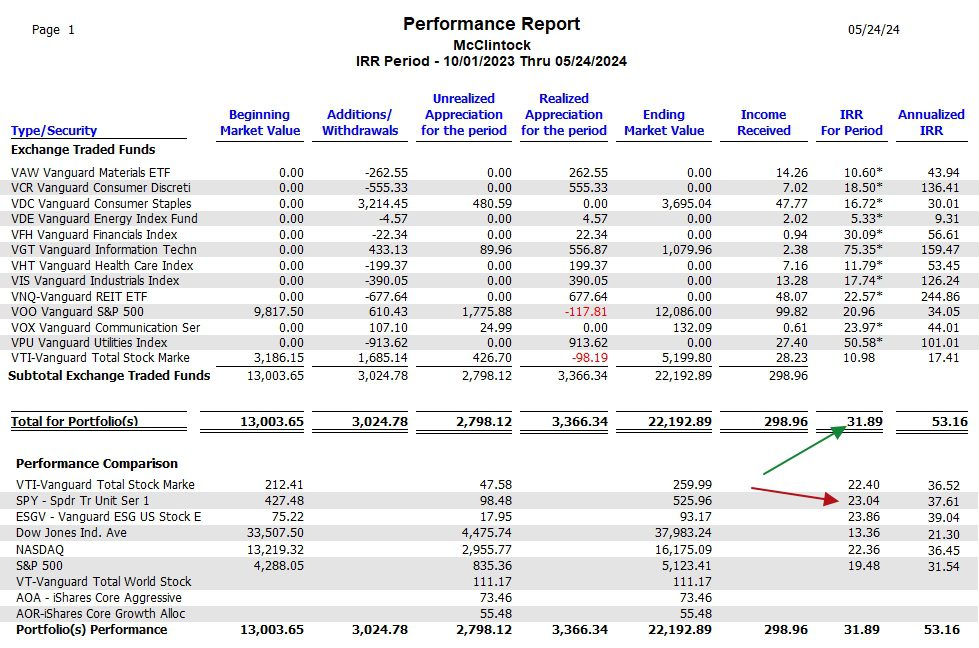
I began using the Sector BPI model with the McClintock around October 15 of 2023. I keep monthly data for the Investment Account Manager software so I begin with 10/01/2023 when the McClintock held zero shares in any of the sector ETFs. Since that launch last October the McClintock has generated an IRR of 31.9% while the SPY improved by 23.0%. VGT is the primary contributor to the robust IRR value.
Discover more from ITA Wealth Management
Subscribe to get the latest posts sent to your email.
You must be logged in to post a comment.