
Iris
Bethe is another portfolio using the truncated asset allocation model. A maximum of five Exchange Traded Funds (ETFs) are used to populate the Bethe.
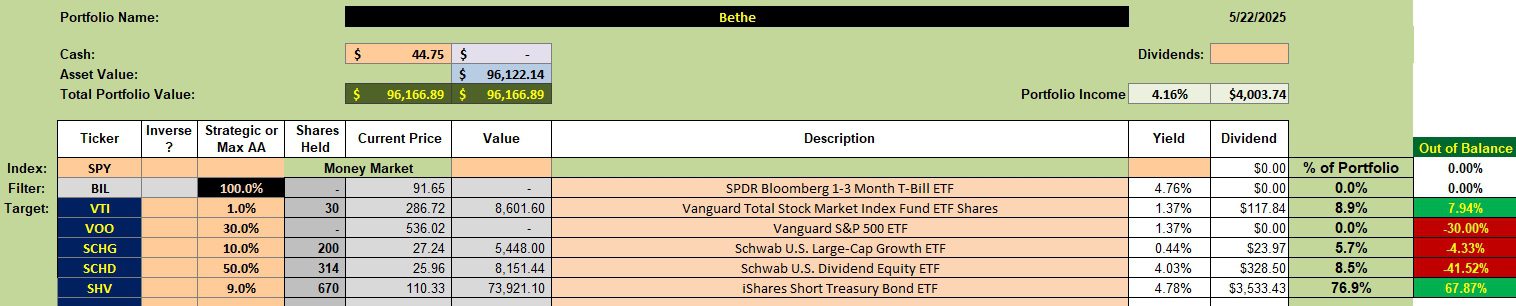
The down market this morning resulted in selling shares of VOO and investing in SHV, a short-term treasury. Erratic tariff threats are once more roiling the stock and bond markets. I had a Trailing Stop Loss Order (TSLO) set for VOO and that limit order was struck. Cash from the sale was reinvesting in the low volatile short-term treasury SHV.
Bethe Security Holdings
As I mentioned above the Trailing Stop Loss Order for VOO was struck and I used that cash to purchase more share of SHV. That is the reason for the odd balance of assets in the Bethe. A TSLO is also in place to sell shares of SCHG.
Bethe Performance Data
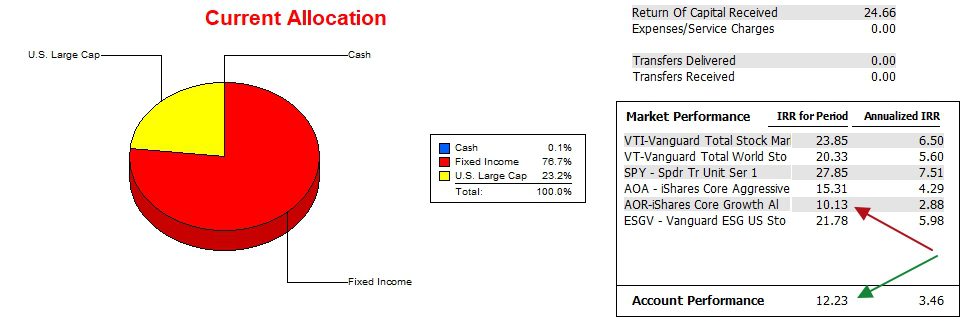
Since 12/31/2021 the Bethe managed to slightly outperform the AOR benchmark, but it is far behind the S&P 500 (SPY). Over the next 3.5 years I plan to concentrate on preserving capital with this portfolio as the owner is not interested in taking on too much risk.
Bethe Risk Ratios
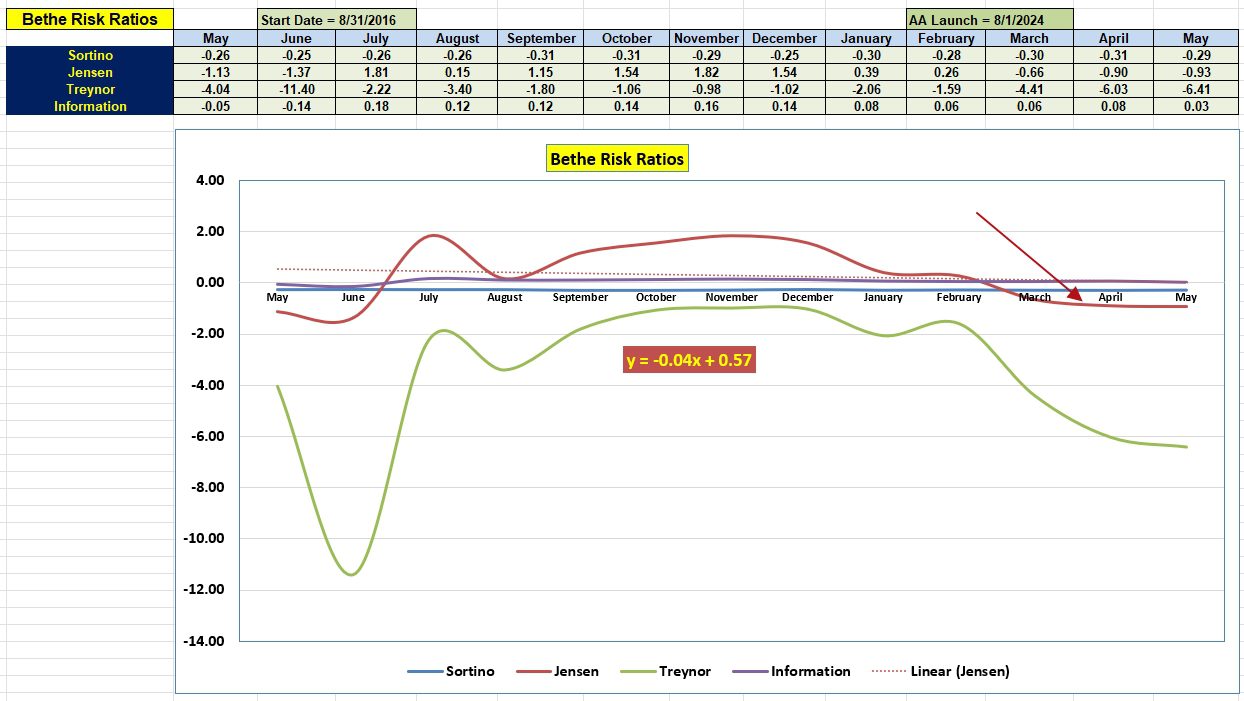
The May 2025 data is not significantly different from the May 2024 data. How does one read information from these four risk ratios?
- If the Sortino Ratio is increasing the portfolio is increasing in value. Since January the value of Bethe increased slightly.
- The Jensen Alpha or Jensen Performance Index is the most important of the four risk measurements. Anything above zero is excellent. Even though Bethe is outperforming its benchmark, the lead is insufficient to bring about a positive value for the Jensen Alpha. The current Jensen is well off its high of November 2024.
- The Treynor Ratio is the least important of the four risk values as it is too dependent on the portfolio beta. The current Bethe beta is a very low 0.21, due in large part to holding a high percentage of the portfolio in SHV. Right now the Internal Rate of Return (IRR) of Bethe is lower than the short-term interest rate so a low beta creates a lower Treynor value.
- The Information Ratio is where one goes to see the relationship between the performance of the portfolio and the benchmark. Positive values indicate the portfolio is outperforming the benchmark. The higher the positive value the better. There is a high correlation between the Information Ratio and the Jensen Performance Index.
Buffett Indicator & Shiller PE Ratio
Discover more from ITA Wealth Management
Subscribe to get the latest posts sent to your email.
Lowell,
What are you using for TSLOs?
~jim
Jim,
I’ve been setting TSLOs quite “close” or between 2.5% and 4.0%. If this were a “pre-Individual-1” administration I would be using TSLOs closer to 8.0%.
Lowell