
Kennewick Ferry – Washington State
Last Friday VPU and VNQ were sold out of the Bohr as the Trailing Stop Loss Orders (TSLOs) were struck. The sale of these two sector ETFs results in a 34% cash level so some decisions are required as to what to do with this money. No sectors are currently in the Buy or oversold zone so we revert to the three U.S. Equity ETFs, VTI, ESGV, and VOO. ESGV is currently the highest rated of these ETFs.
Software Opportunity: Are any readers interested in purchasing the portfolio tracking software Investment Account Manager? If so, I think I can work out a special price with the developers. Let me know in the Comment section provided below or contact me at itawealth@comcast.net for more information.
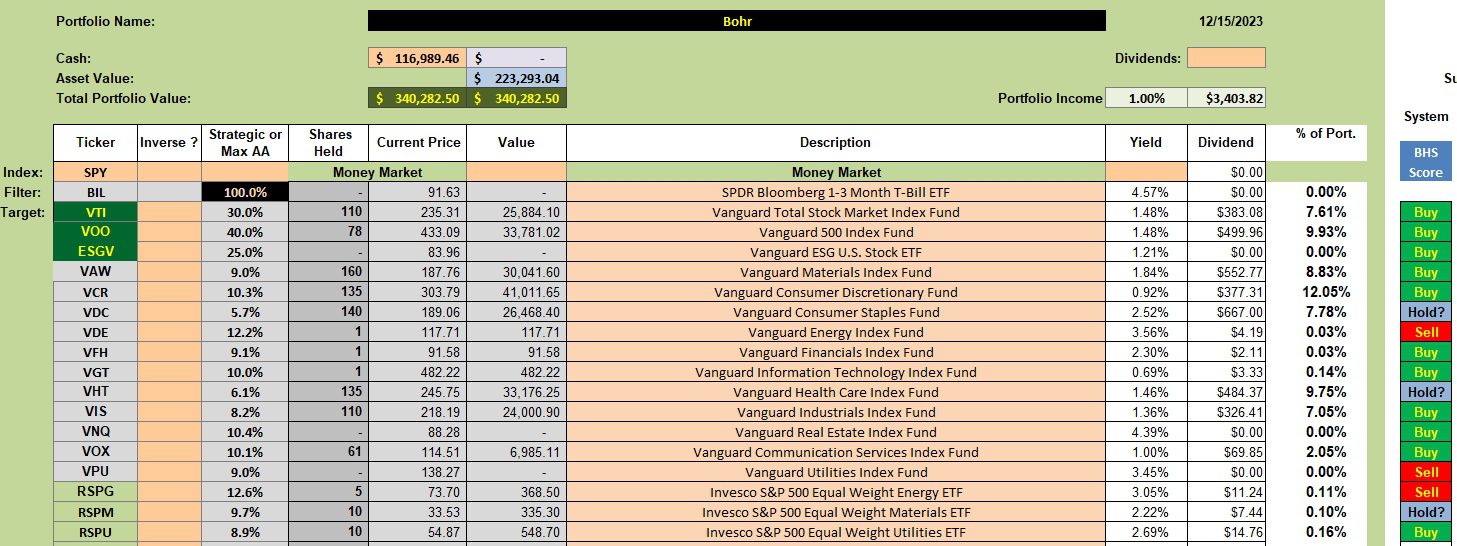
Bohr Investment Quiver and Holdings
Below are the current holdings in the Bohr portfolio. Readers will note that I am gradually including a few equal-weight ETFs such as RSPG, RSPM, and RSPU. When a sector drops into the Buy or oversold zone, I plan to compare the 5-year performance between the cap-weighted and equal-weighted ETFs and purchase the one with the superior performance. Performance data will come from the Finance-Yahoo site.
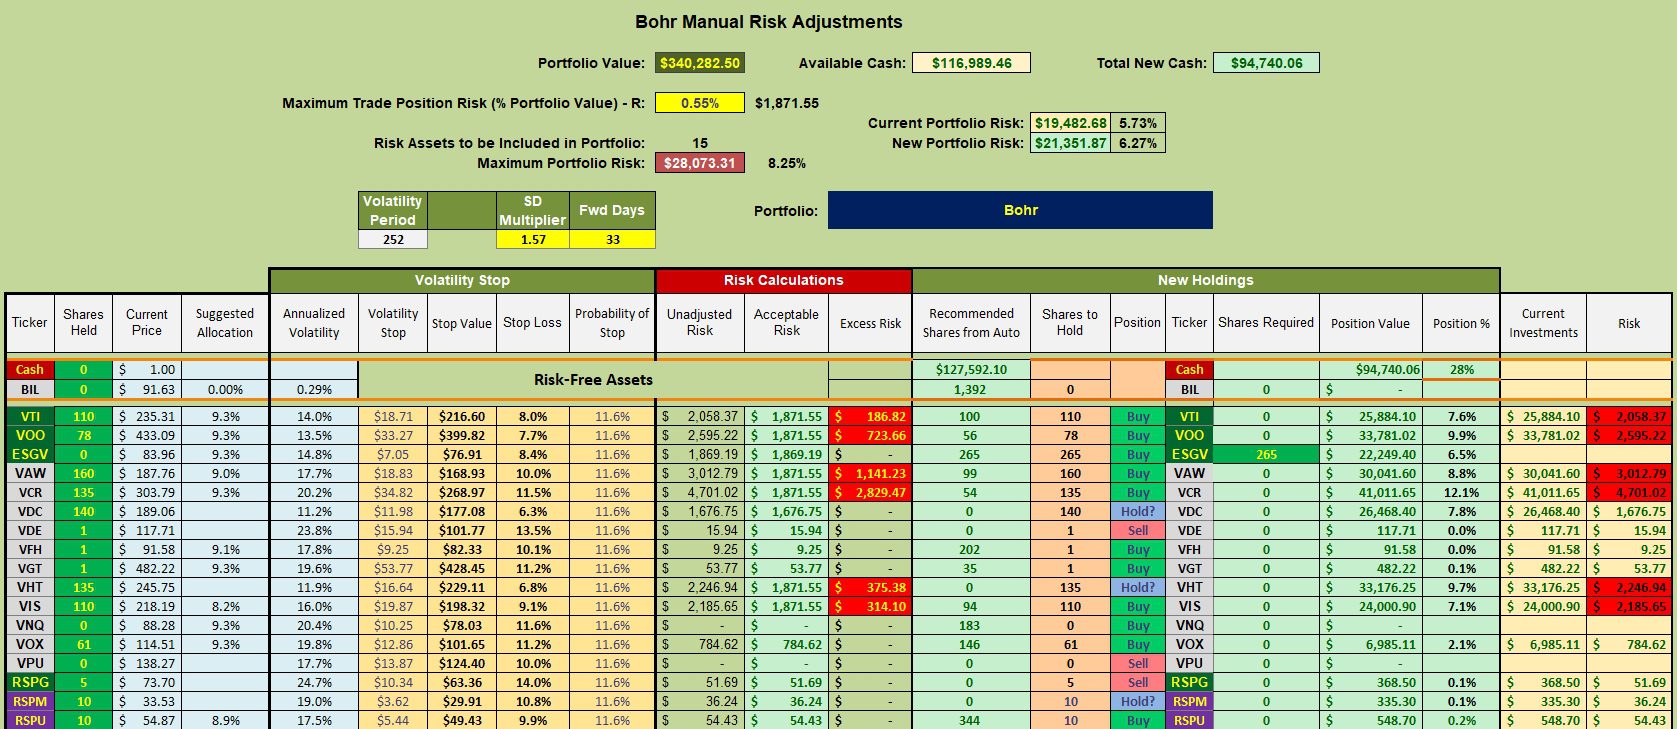
Bohr Manual Risk Adjustments
Since ESGV is the highest ranked of the three U.S. Equity ETFs I am placing limit orders to add the recommended 265 shares of this socially responsible ETF. VTI and VOO are oversubscribed so I will not add more shares to either. It looks like the Bohr will sit on quite a bit of cash for a few months.
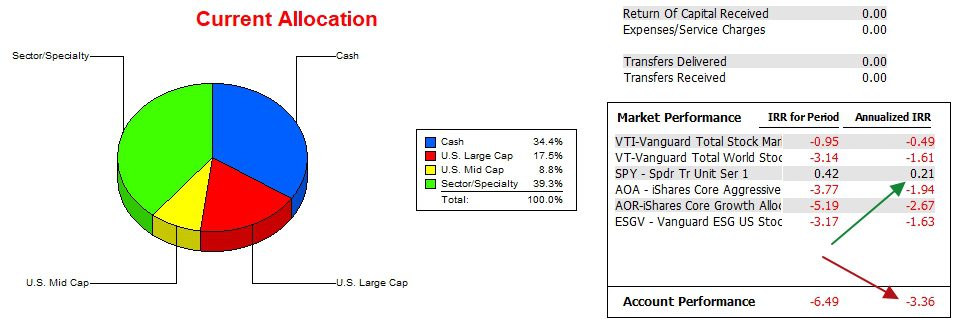
Bohr Performance Data
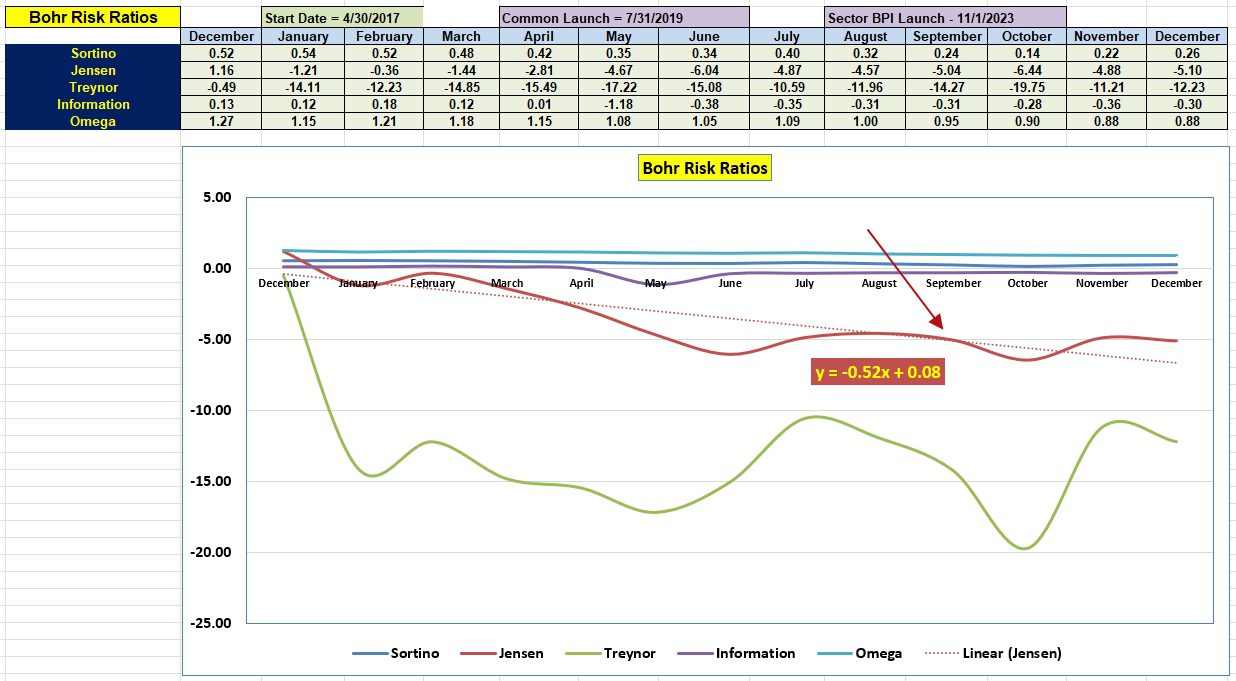
Over the past two years the Bohr lagged the SPY benchmark. Since the Bohr has only been using the Sector BPI model for six weeks it is still too early to draw any conclusions. The Risk Ratio table is the best place to pick up any trends.
Bohr Risk Ratios
One of the reasons for switching Bohr to the Sector BPI model is evident in the following table. Each of the risk measurements is currently lower than it was a year ago. If we go back to the end of October or when the investing model was switched. Improvement shows up in the Sortino Ratio, Jensen Alpha, and Treynor Ratio. Where the Bohr goes head to head with the benchmark is shown in the Information Ratio and here the benchmark is outperforming the Bohr.
It will be at least another year before we have useful clues as to whether or not the Sector BPI model is serving the Bohr as anticipated. The slope of the Jensen, now a negative 0.52, will need to show improvement as we progress through the next few months.
Tweaking Sector BPI Plus Model: 20 May 2023
Discover more from ITA Wealth Management
Subscribe to get the latest posts sent to your email.
Lowell,
I’m an existing user and plan on renewing so see if they’ll apply any discount to renewals.
Bob W.
Bob,
Thus far no discounts to existing users. I am a beta tester and have not been given any discounts.
Lowell