
Bicycle show at Portland Art Museum – Image made a few years ago.
Bohr poses interesting investing decisions as the investing model for this portfolio is migrating toward the Sector BPI Plus style. What to do with all the Closed-End-Funds (CEFs) is the primary question, particularly as we are closing out the third quarter and dividends are no trivial matter. The $25,000 in cash will be divided among those sector ETFs that are currently in the oversold zone.
Bohr Investment Quiver and Holdings
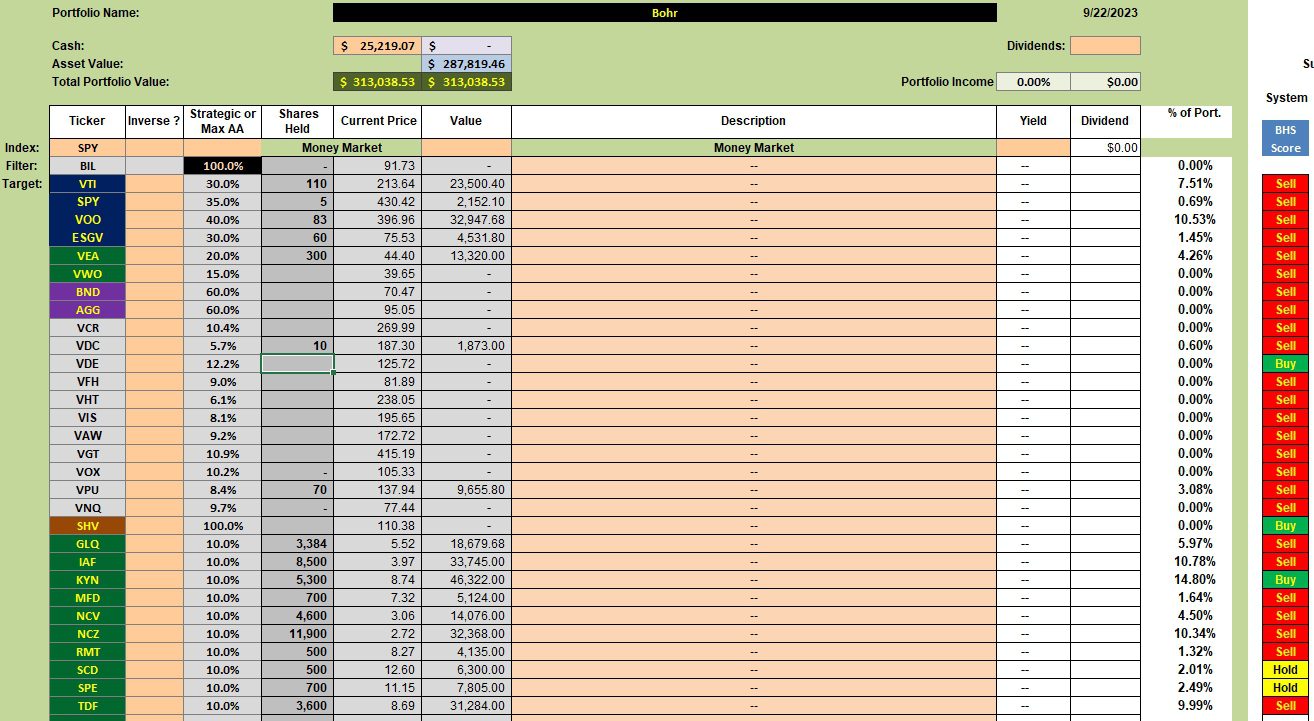
Below is the current investment quiver and holdings. The one exception is that 10 shares of VEA were sold as I was writing this blog so the Bohr is now holding 290 shares instead of 300.
Limit orders are in position to sell off the CEFs, but the strike price for each security is set high enough the orders are unlikely to sell as I will collect the dividends at the end of the third quarter. Early next month the Bohr will be updated so that all the oversold sector ETFs, if still in the Sell zone, will be filled. Otherwise I will add more shares to U.S. Equities as cash becomes available.
Bohr Security Recommendations
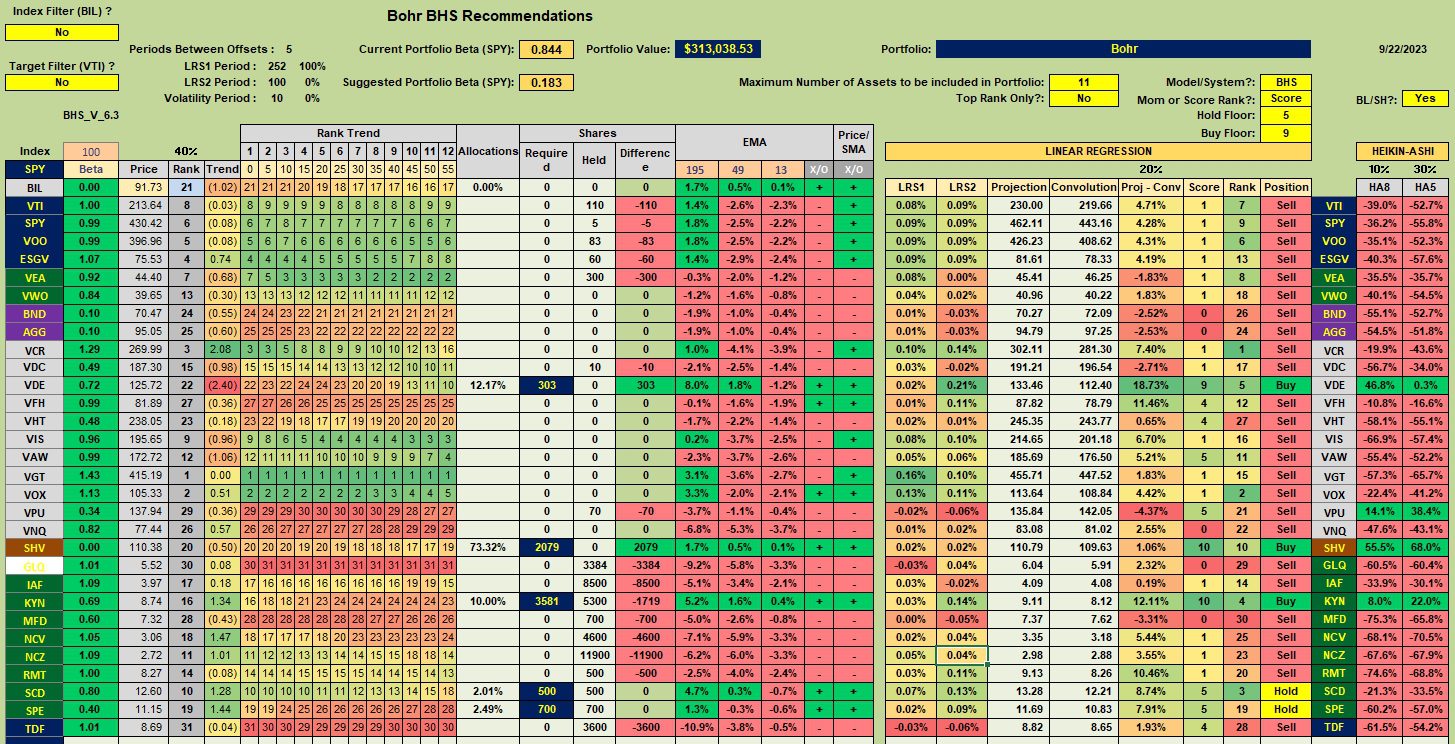
The following recommendation worksheet from the Kipling spreadsheet is used for guidance purposes only. The sector ETFs (light gray background) are populated or purchased based on Bullish Percent Indicator (BPI) data. After the oversold sector ETFs are filled one moves on to the U.S. Equities. Currently, none are recommended for purchase. When this is the case there are several choices. One option is to leave the money in the money market. That is not a bad choice as money markets are now returning a reasonable interest rate. Another choice is to purchase shares of SHV where the interest rate is around 3.6%.
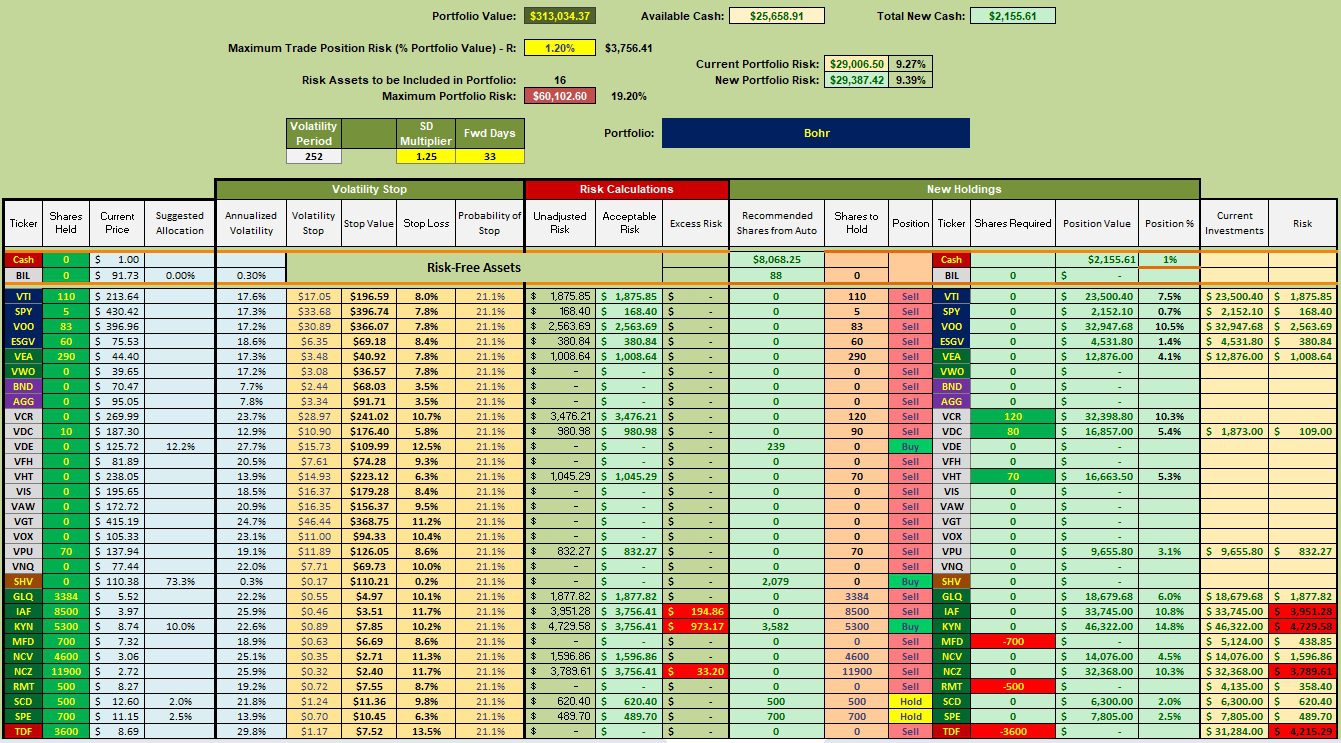
Bohr Manual Risk Adjustments
The latest BPI data found Discretionary, Staples and Health to be oversold. Available cash will be used to buy shares of VCR, VDC, and VHT.
Bohr Performance Data
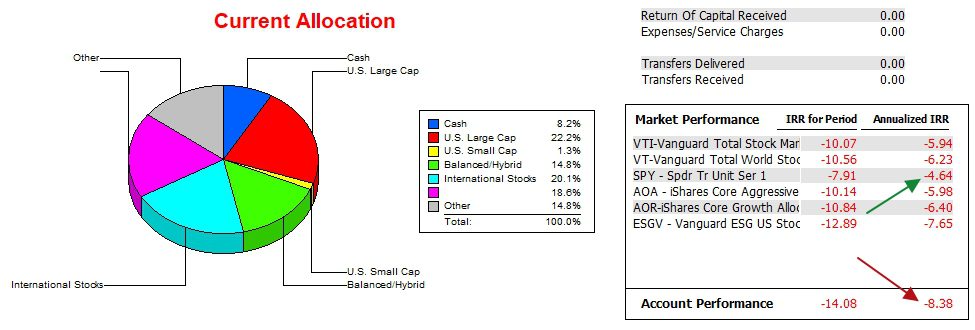
Readers will see the Bohr is still digging its way out of a hole when compared with all the listed benchmarks. This is a primary reason for migrating the portfolio to the Sector BPI Plus investing style. The data goes back to 12/31/2021 or about 21 months of information.
Bohr Risk Ratios
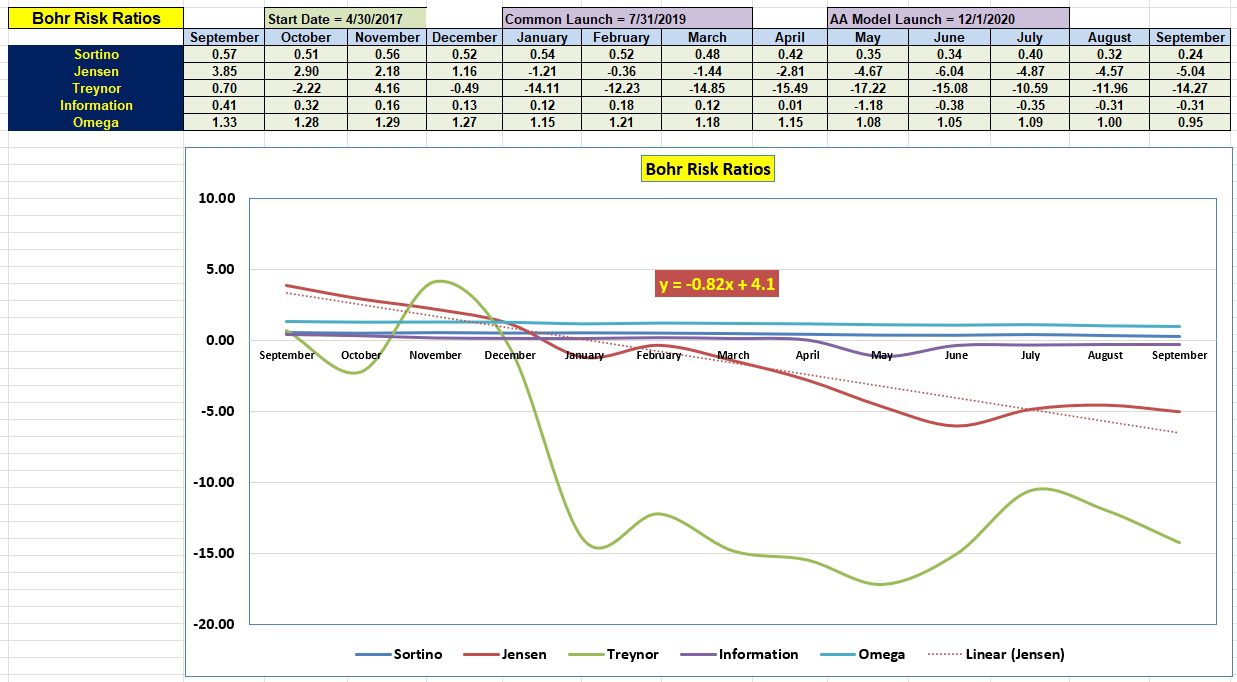
A similar grim performance report shows up in the risk ratio data. While the Information Ratio, a direct measure of portfolio performance with the benchmark, is showing improvement since last May, it is still insufficient.
In the coming months pay attention to the trends of the Sortino Ratio, Jensen Alpha, and Information Ratio. Those are the three most important risk measurements. Also, follow the slope of the Jensen. When last reviewed the slope was negative 0.96 so there is some improvement.
“Don’t fight the FEDs” is a common mantra. Since the Federal Reserve plans to keep interest rates high for another two years as they fight to lower inflation down to 2%, stocks are going to face this head wind. This is a time to use patience when purchasing U.S. Equities.
Discover more from ITA Wealth Management
Subscribe to get the latest posts sent to your email.
Hi Lowell,
A quick question about the use of excess cash in this portfolio. Why would you choose to park cash in SHV rather than Bil since Bil is paying over 5% vs 3.6% for SHV?
Thank you,
Bill
Bill,
According to Finance-Yahoo BIL is yielding 3.8% while SHV is 3.66%. Do you have another source for interest rates?
I need to check but I think Schwab money market is higher than both these ETFs.
Lowell
Hi Lowell,
Yes, you’re right about yahoo but I looked at the actual historical data tab and calculate the monthly return and it’s over 5%. Also in Schwab’s details page about Bil it reports a “Distribution Yield” of 3.8% and a “Yield (30 day)” of 5.16%. I don’t understand the the difference but it matches closely to the historical data I see on Yahoo.
Bill
In going back on Yahoo and looking at the actual distribution rate of SHV, it is also about 5%. So I guess there isn’t very much difference between SHV and BIL. They’re both about 5%. Pretty good yields considering the current market risks.