
Shadows
“Bullish Percent Indicators are technical analysis tools used in financial markets to gauge the overall sentiment of investors. They are represented by Point and Figure graphs, which track the percentage of stocks in a given market or index that are exhibiting bullish patterns. These indicators help traders and investors assess market conditions and make informed decisions based on the prevailing sentiment.”
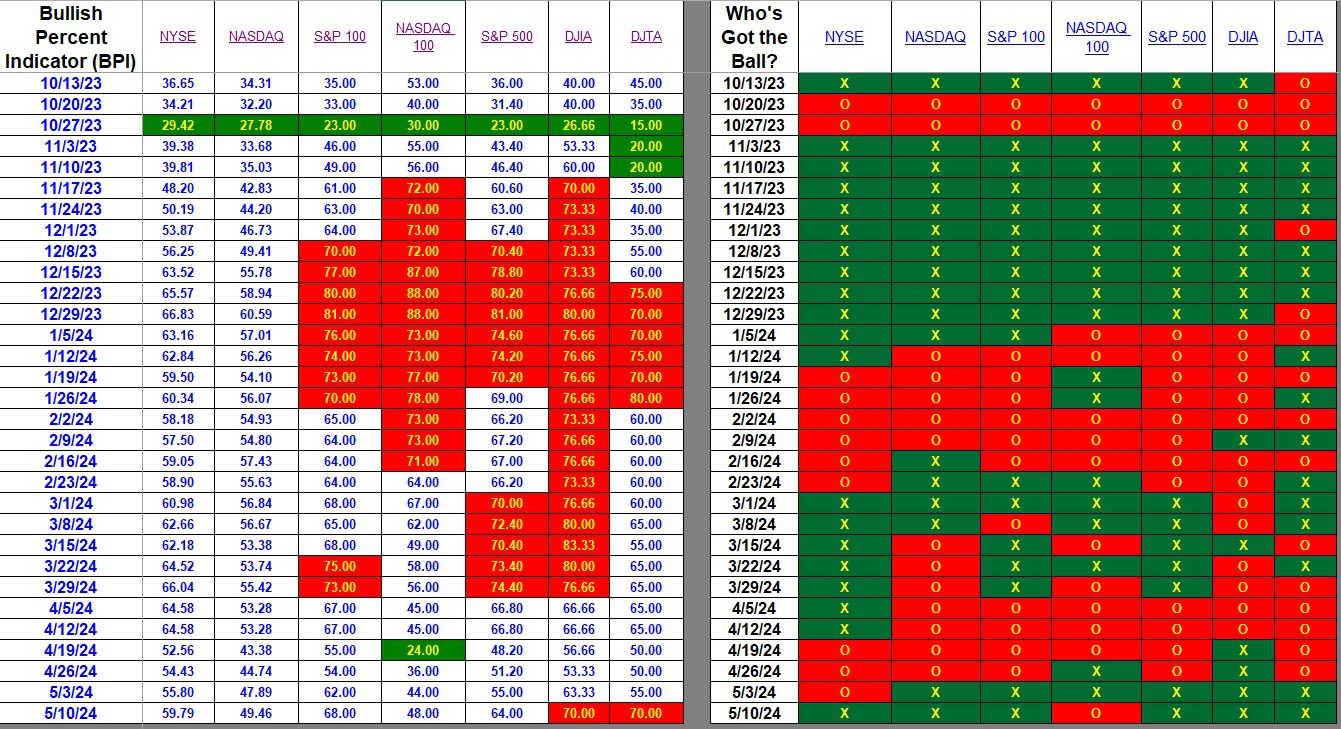
The above Artificial Intelligence generated paragraph is quite accurate in explaining what happens in the following two data table. In the first table we check seven major indexes and this week all are bullish with one exception (NASDAQ 100). The NASDAQ 100 is an anomaly as the percentage of bullish stocks actually increased. This difference happens rather frequently due to action at the end of the week.
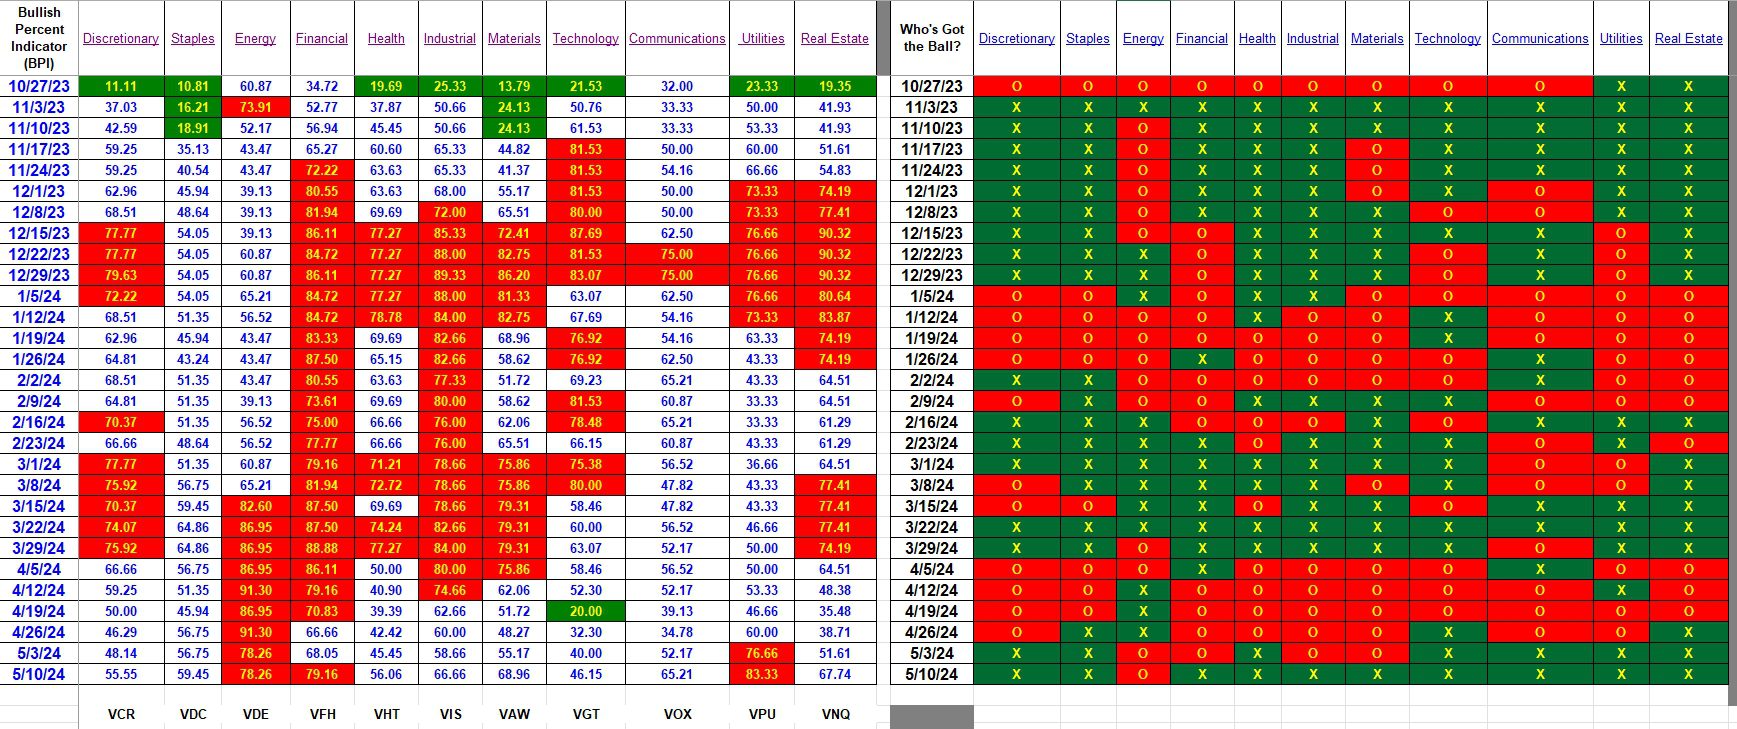
The second BPI table focuses on sectors of the market. The eleven sectors are what we use to manage the Sector BPI portfolios. Kepler is one Sector BPI portfolio scheduled for review this week. I am using the Sector BPI investing model with a number of portfolios as it is proving itself to be quite successful.
Index BPI
Based on the index information below, this was a strong week for U.S. Equities. Major percentage jumps occurred in both Dow Jones Averages indicating large-cap stocks were strong. Increases in both the NYSE and NASDAQ, while modest, are encouraging. May is off to a good start.
Sector BPI
Three sectors are oversold (correction – overbought) so check your portfolio, if you are managing a portfolio using the Sector BPI model, and set Trailing Stop Loss Orders (TSLOs) for VDE, VFH, and VPU. I use a minimum of 3% for my TSLOs.
Forward this URL on to friends and family members. Thank you in advance.
Discover more from ITA Wealth Management
Subscribe to get the latest posts sent to your email.
Three sectors “overbought” rather than “oversold”?
David
Will correct. Thanks.
Lowell