
Lunch Restauraunt in Cambridge, England
It was another crazy week in the US equity markets with the SPX (S&P 500 Index) closing the week ~5.7% higher than last week’s close:

In the above Daily chart we can see that prices dropped to ~4800 on Monday before bouncing off this 50% retracement level – a 22% pullback from the highs of the bullish trend that started at the October 2022 lows to the recent February 2025 highs (this is more clearly seen in the weekly chart shown below). The most disturbing thing about price action over the past seven trading days is that volatility, as measured by the Average True Range (ATR) Indicator, has risen from ~60 SPX points per day to over 195 points per day – or over 3 times the average daily range. Just look at the size of those bars compared to all the previous ones – and this is a 14-day average, so, if this level of volatility continues, the average could increase even higher – Wednesday’s range was over 530 points – almost unheard of except for single one-day “Black Swan” crash events.
Below is an updated weekly chart, similar to the one that I showed last week and shows the possible support and resistance levels/zones as determined by an analusis of Fibonacci ratios:
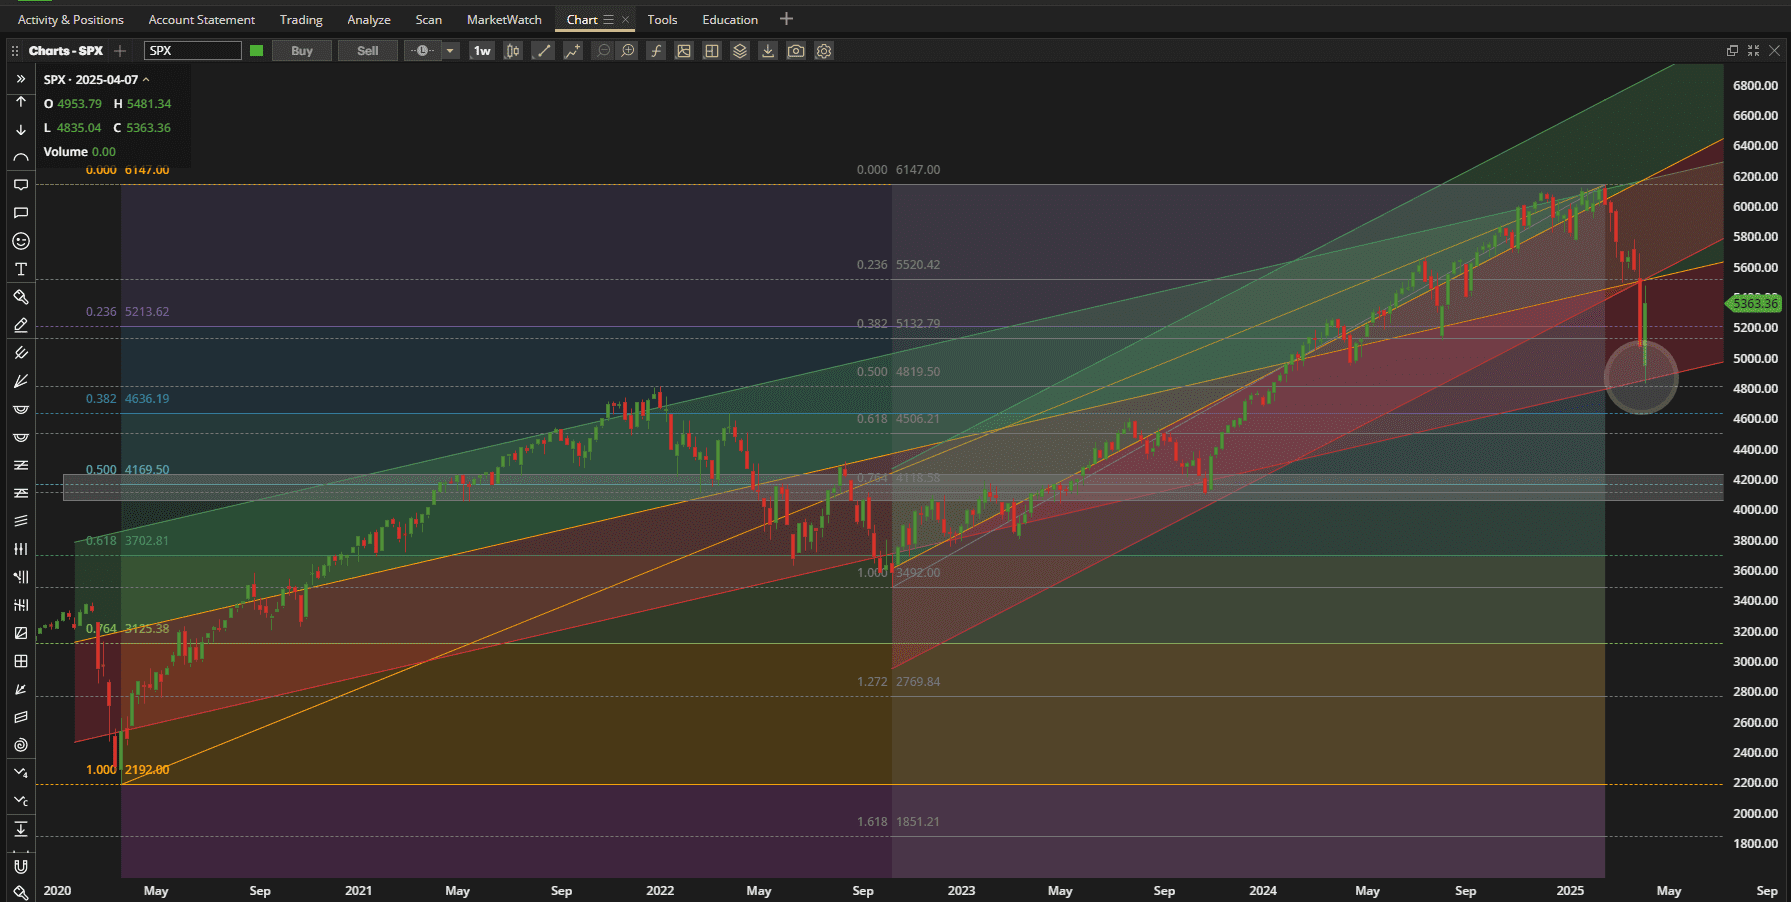 Where we go from here is anyone’s guess – so investment is difficult and some degree of caution may be called for – depending on our investment horizons.
Looking at the performance of the major asset classes over the past week:
 we see that Silver (SLV) recovered after falling to the bottom of the list last week with equities also doing well globally. Bonds took the biggest hit.
In the Darwin portion of the Rutherford-Darwin Portfolio,
 we saw a reflection of that high volatility but with the portfolio still managing a 1% gain on the week.
Again, it was the Rutherford Options portion of the portfolio that gave me the biggest headaches and was difficult to manage. After closing a number of my positions last week I was only left with positions in VNQ (bearish “Diagonal” spread), TLT (2 bullish “Diagonal” Spreads) and IBIT (unbalanced “Vertical” Spreads). However, my “rules” for these positions was to make adjustments with a move of 1.5x the Daily Average True Range of the underlying ETF. With moves well in excess of this (closer to 4x) it was difficult to find “neutral” positions and more likely get subjected to whipsaw trades – so I chose to close down my positions in TLT and IBIT – leaving only VNQ, that wasn’t moving quite as much as everything else – but still needed the short-term legs rolling to next week’s expiration. On Friday, I did open a new bullish “Vertical” Spread position in Silver (SLV) as this ETF showed evidence of recovery from the unexpected (by me) weakness shown a week earlier.
Obviously, it is difficult to manage these Option trades in the current market environment – so I will be taking it a little easier until markets settle down a bit. My timing in getting into this situation was obviously bad (although unpredictable) – but at least my exposure is limited to ~10% of total portfolio value whose performance (green line) currently looks like this:

Discover more from ITA Wealth Management
Subscribe to get the latest posts sent to your email.
You must be logged in to post a comment.