
Example of Adamski Effect.
Since my recent Seeking Alpha article there has been increased interest in the ITA blog. This review of the Carson is a tad more detailed than usual so new readers gain a better understanding of the Sector BPI investing model. In addition, the U.S. stock market is closed today in celebration of Martin Luther King Jr.
Based on the most recent posting of the Bullish Percent Indicator (BPI) data, no sectors are positioned in the oversold zone. Oversold is when a particular sector drops to 30% bullish or lower. BPI data is published each weekend unless there is a major market move downward at which time I try to keep readers informed as to which sectors dropped into the oversold zone.
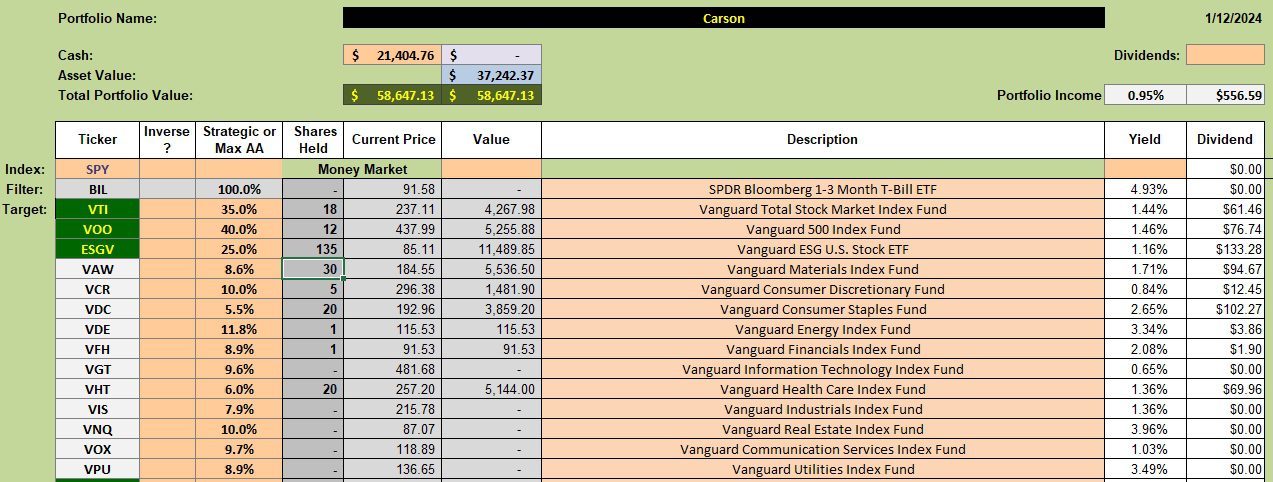
Carson Security Holdings
Below is the investment quiver and current holdings in the Carson portfolio. The percentage for the eleven sectors (Strategic or Max AA column) is calculated based on a three-year average of the annualized volatility. The more volatile the sector the greater the percentage we want to hold in that sector.
When sectors are out of favor, as is currently the situation, we resort to U.S. Equity ETFs such as VTI, VOO, and ESGV. SPY is another option.
Carson Security Recommendations
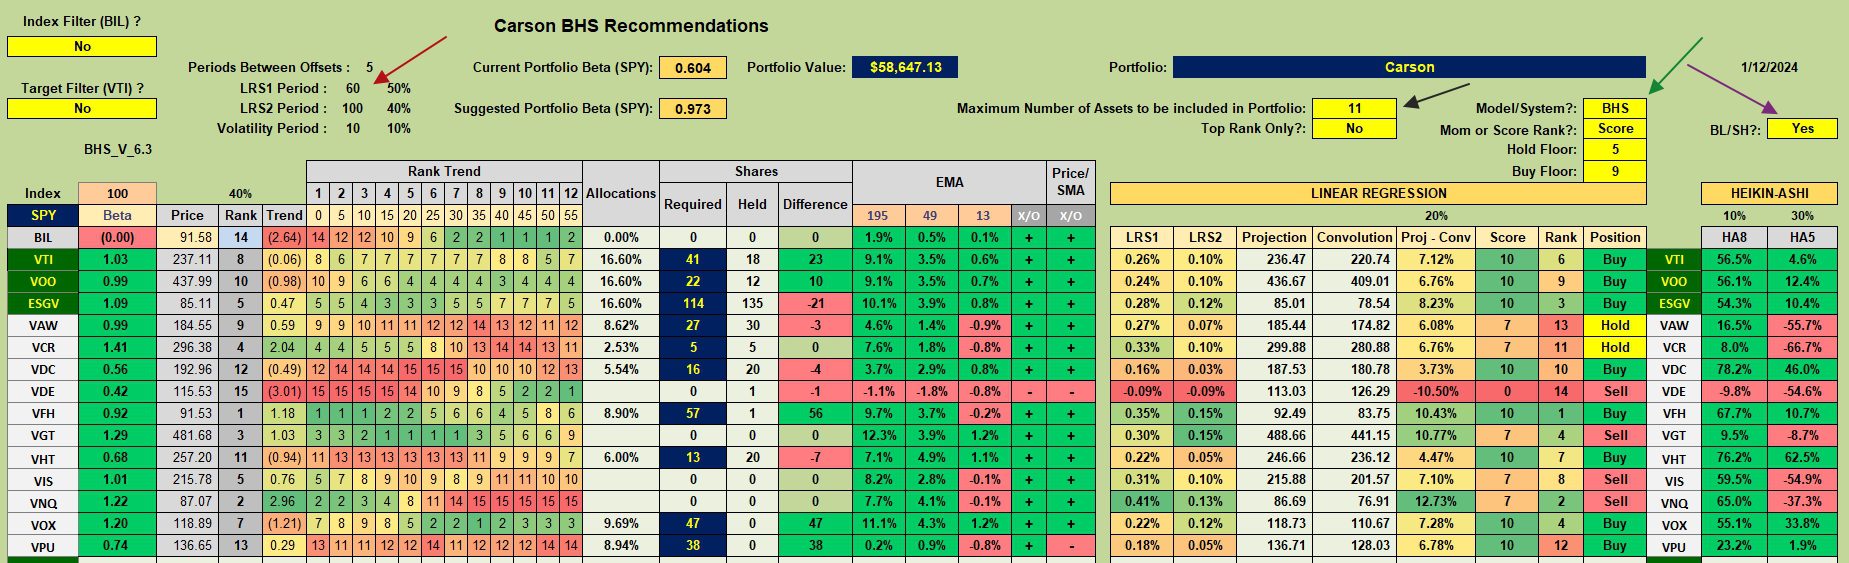
The following table is the Tranche worksheet from the Kipling spreadsheet. The red arrow points to the look-back periods of 60 and 100 trading days. These variables are set in the Main Menu worksheet of the Kipling. The black arrow points to the number of securities to include for investment. I set this to eleven (11) as there are 11 sectors. The green arrow points to the Buy-Hold-Sell model. The Kipling has several investing models. My two favorites based on in-sample testing are BHS and LRPC. For the Sector BPI portfolios I’ve been using the BHS model.
Based on the BHS model and the 60- and 100-trading days look-back period VTI, VOO, and ESGV are all a Buy. This worksheet is not used to recommend any of the sector ETFs as that guidance comes from Bullish Percent Indicator data. Keep the recommendations separate.
Carson Manual Risk Adjustments
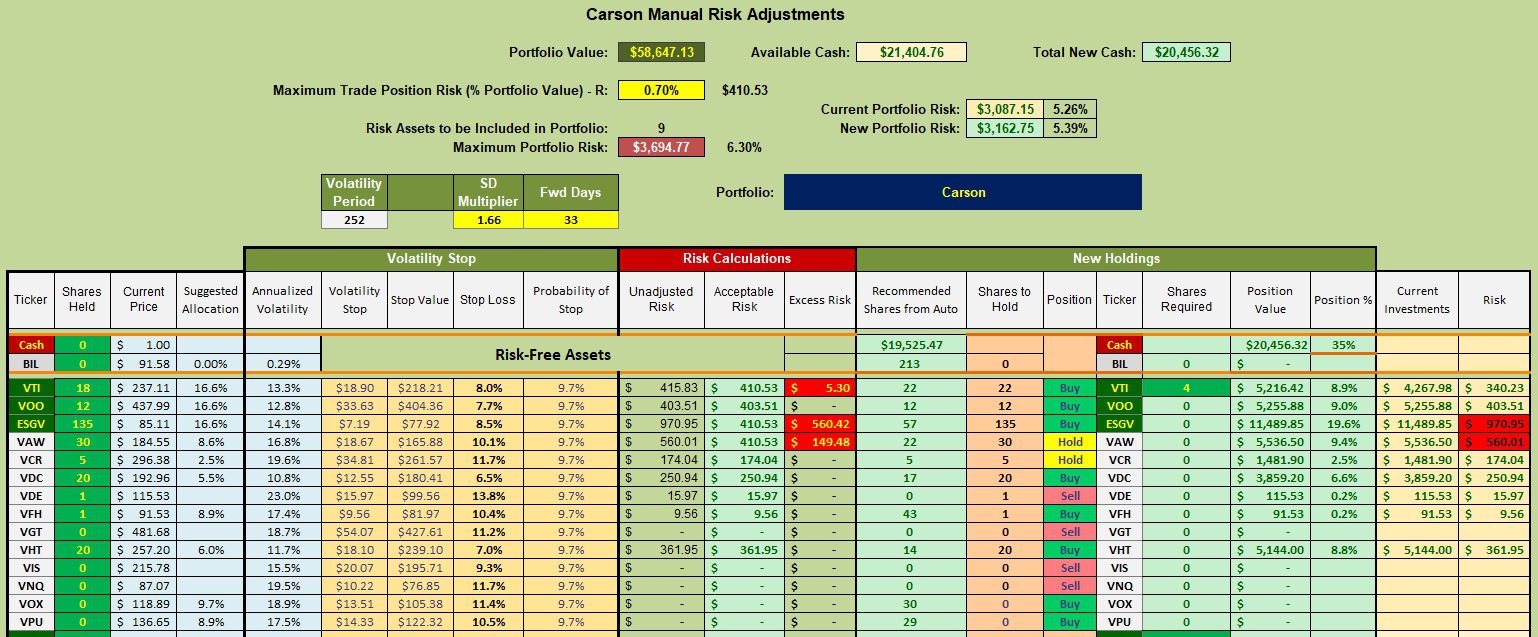
With VTI, VOO, and ESGV all recommended for purchase, how many shares of each should one buy? Those recommendations come from the following worksheet.
There are a few risk settings I make in the worksheet that precedes the one you are looking at below. I adjust the SD Multiplier to 1.66 so the Stop Loss percentage for VTI is 8.0%. This is one setting that helps limit portfolio losses. The second setting is the Maximum Trade Position Risk – R percentage. For the Carson portfolio I have this set to 0.70% so the Maximum Portfolio Risk is 6.3%. I want the risk figure to come in close to six percent (6.0%). This six percent value has a lot to do with controlling how many shares should be held by VTI, VOO, and ESGV.
Check the 8th column from the right. VOO and ESGV are oversubscribed while we need to add four more shares of VTI to meet the recommended number of shares. I have a limit order in place to pick up these four shares.
This still leaves over $20,000 in cash which is a very large percentage of the Carson. The options are to leave this money in the money market or set limit orders to purchase more shares of VTI, VOO, and ESGV. I favor setting limit orders to add shares to these three U.S. Equity ETFs, but the limit orders are set well below current prices. I ladder down the limit orders from 1% down to as low as 15% below the current price. If you look at the Annualized Volatility (5th column from the left) the volatility of VTI, VOO, and ESGV is not far below 15%. We can expect these ETFs to bounce around these volatility percentages sometime over the next year.
Carson Performance Data
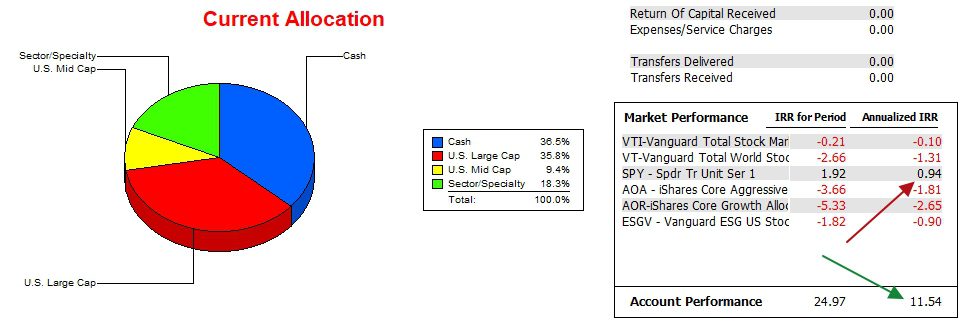
The following data is from 12/31/2021 through 1/12/2024 or a little over two years. The annualized Internal Rate of Return for the Carson is 11.5% while the S&P 500 (SPY) is o.9%. This information comes from the commercial software program, Investment Account Manager. I highly recommend serious investor use this program. I happen to be a tester of this software and I think I can leverage a discount on the purchase price. I pay an annual fee to have access to Quote Media prices. I’ve been using this software going back to DOS days and have found it consistently balances with broker statements to the very penny.
Carson Risk Ratios
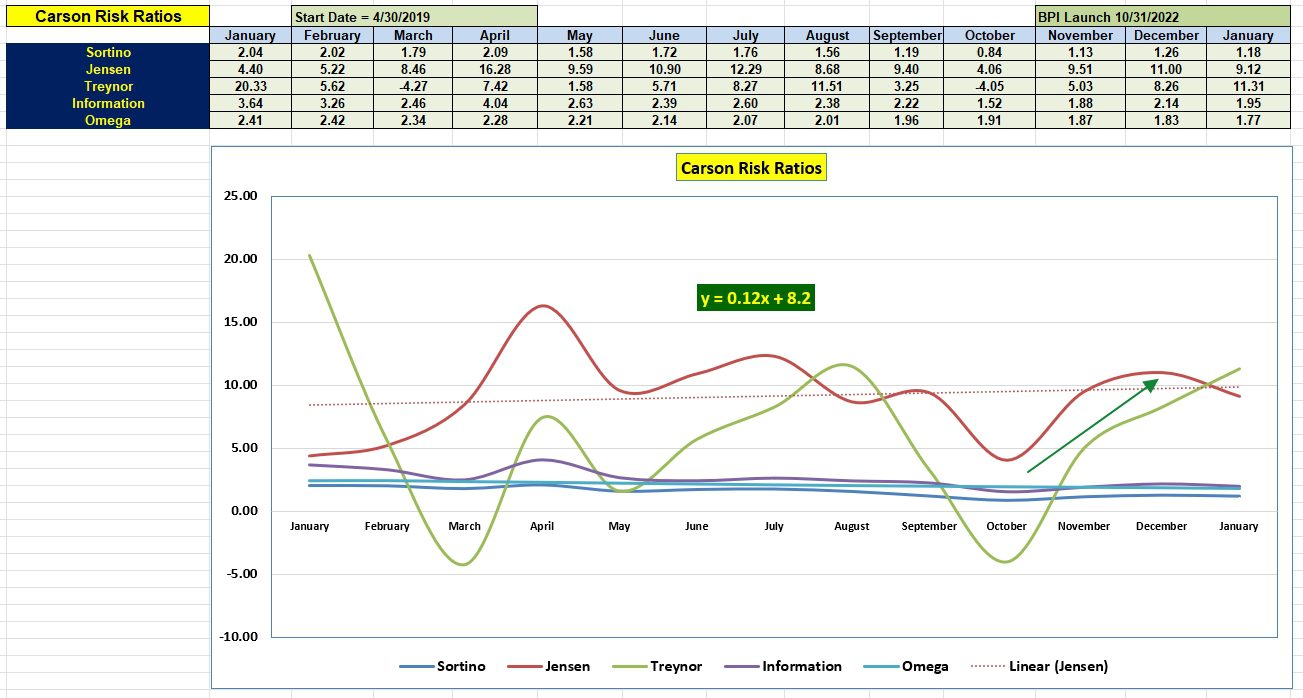
The following Risk Ratio data is proprietary to the ITA Wealth Management blog and most likely is not found elsewhere. The three most important risk measurements are in order of importance: Jensen Alpha or Jensen Performance Index, Information Ratio, and Sortino Ratio. The Treynor is too heavily dependent on the portfolio beta and the Omega Ratio is a mirror of the Sortino Ratio.
A portfolio is performing very well if either the Information or Jensen values are greater than zero. A Jensen of 9.12 is exceptional and will be most difficult to maintain.
Another important measurement is the slope of the Jensen. Once more, any positive slope value is excellent so the current number (0.12) of the Jensen is to be commended.
Carson Portfolio Report
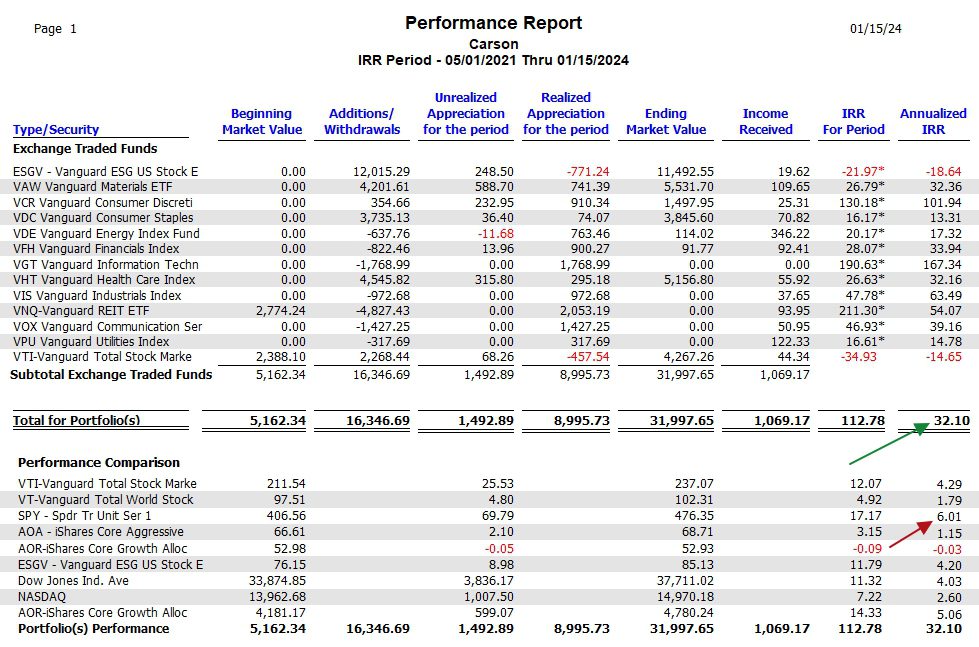
The following portfolio report goes back to just before the Carson began following the Sector BPI approach. Note the 5/1/2021 start date. Most of the portfolios following the Sector BPI investing model have only been using this approach for a few months.
Over the stated period the Carson Sector BPI model generated an annualized IRR of 32.1% while the SPY benchmark returned 6.01%, a major difference.
ESGV within the Carson is lower than the ESGV benchmark due to investments during different periods. The same holds true for VTI.
The reason for VNQ to have a beginning value of $2,774.24 is that VNQ was an asset class held in the Carson before the portfolio was switched to the Sector BPI investing model.
This data also comes from the Investment Account Manager software.
There are bound to be comments or questions. If so, please leave them in the Comment section provided below.
If you find the Sector BPI investing model of interest, send the ITA link to your friends and relatives.
If the Sector BPI investment model is too complicated, check out the Schrodinger and Copernicus portfolios tracked here at ITA.
Tweaking Sector BPI Plus Model: 20 May 2023
Discover more from ITA Wealth Management
Subscribe to get the latest posts sent to your email.
You must be logged in to post a comment.