
Cabin on Molalla River.
Copernicus is a U.S. Equity only portfolio. In other words, the only investments are U.S. Equity ETFs. As such the Copernicus is nearly guaranteed to outperform the S&P 500 if two conditions are met. 1) The market is higher when the performance calculation is conducted. 2) The portfolio does not carry too much cash.
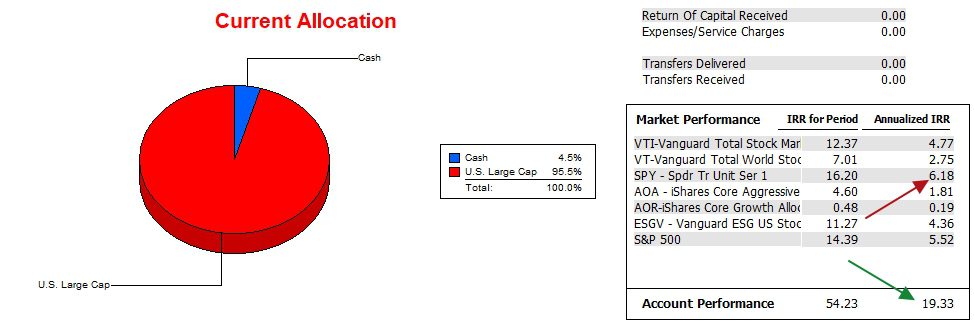
How does this work so well? It is known as dollar-cost-averaging. If one invests regularly and the market continue to climb, those VOO shares for example will show greater gains than the S&P 500. The Copernicus is such an example as shares of VOO, SPY, VTI, and SPY were purchased when the market was in decline in 2022. Shares purchased at lower prices are now showing a high Internal Rate of Return (IRR) percentage.
A major drawback to the Copernicus style of investing is the lack of downside protection. This could pose a problem if one retires during a recession or worse. For this reason, I recommend portfolio diversification in addition to security diversification. Both are used on this ITA blog.
Copernicus Security Holdings
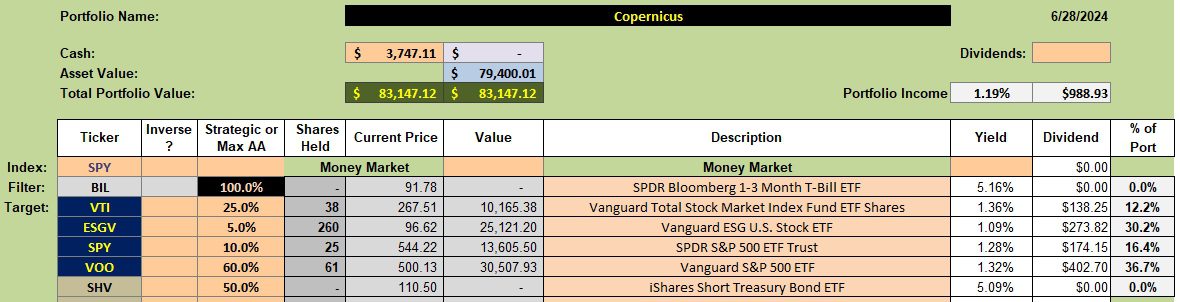
Below is the current portfolio makeup of the Copernicus. Since ESGV is over-weighted, I have an 8% TSLO set to sell 125 shares of ESGV. The 8% is rather high as I am in no hurry to sell any shares out of the Copernicus. With the $3700 in cash I have numerous limit orders set to purchase VOO and VTI. Most of the orders are set for VOO as that ETF mirrors the benchmark we are attempting to match or exceed.
Copernicus Performance Data
Since 12/31/2021 the Copernicus is far outpacing the SPY benchmark as well as all the other potential benchmarks. The gap is due to money added to this portfolio when the market was down in 2022 allowing for the purchase of equity ETFs at much lower prices. This goes back to the dollar-cost-averaging model or one I highly recommend for young folks just getting started in their retirement program.
Copernicus Risk Ratios
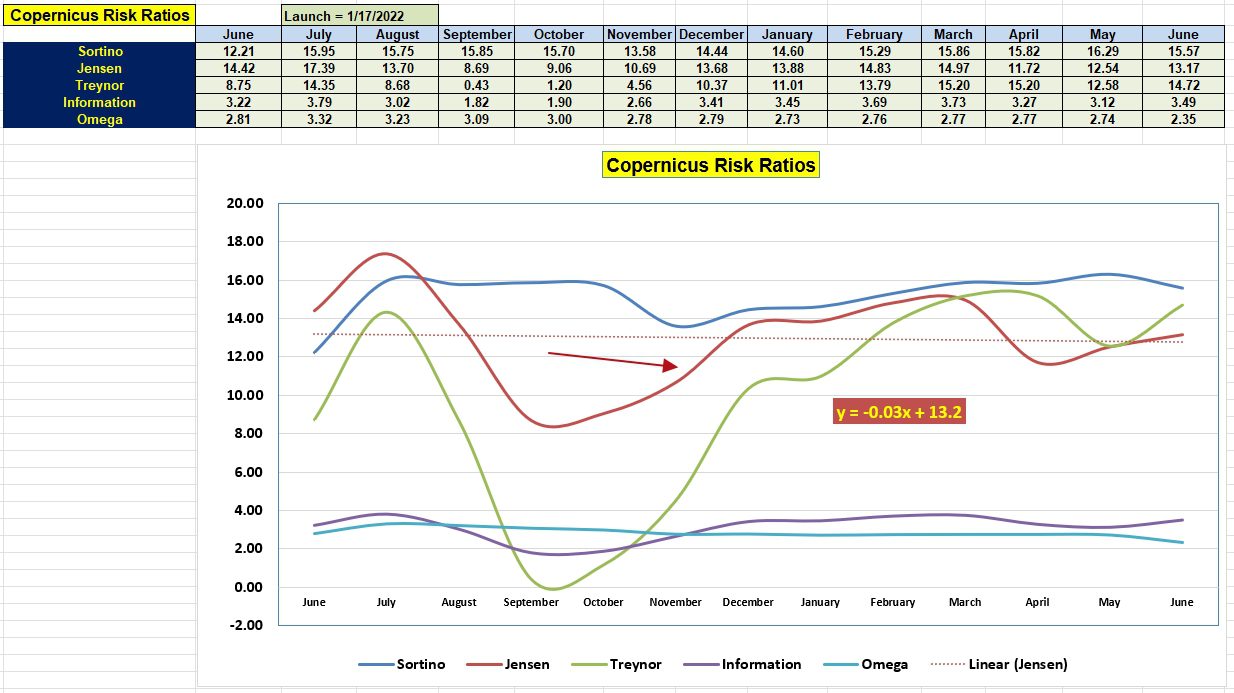
While this is the first of July, the data below is for June. There are a lot of positive values in the following table. While an all equity portfolio is considered risky, the following data over the last year indicates otherwise. In a recession this data would look quite different so keep that in mind.
For new readers, pay most attention to the Jensen Performance Index and the Information Ratio.
Once we clear August the slope of the Jensen should turn positive.
Similar portfolios to the Copernicus, but with more security diversification are: Huygens and Pauling.
Huygens Asset Allocation Portfolio Review: 10 April 2024
Pauling II Update: 1 April 2024
Discover more from ITA Wealth Management
Subscribe to get the latest posts sent to your email.
You must be logged in to post a comment.