
Cutty Sark, Greenwich, London
The Hawking “Income” Portfolio does not require an excess level of attention to manage – it is simply a matter of re-investing dividends/distributions as they become available. With the pullback in prices since the last review in January it has been possible to pick up new shares at lower prices that should help going forward or at such time that prices recover to prior levels – thus benefitting from “dollar cost averaging” of Fund prices. At present, holdings in the portfolio look like this:
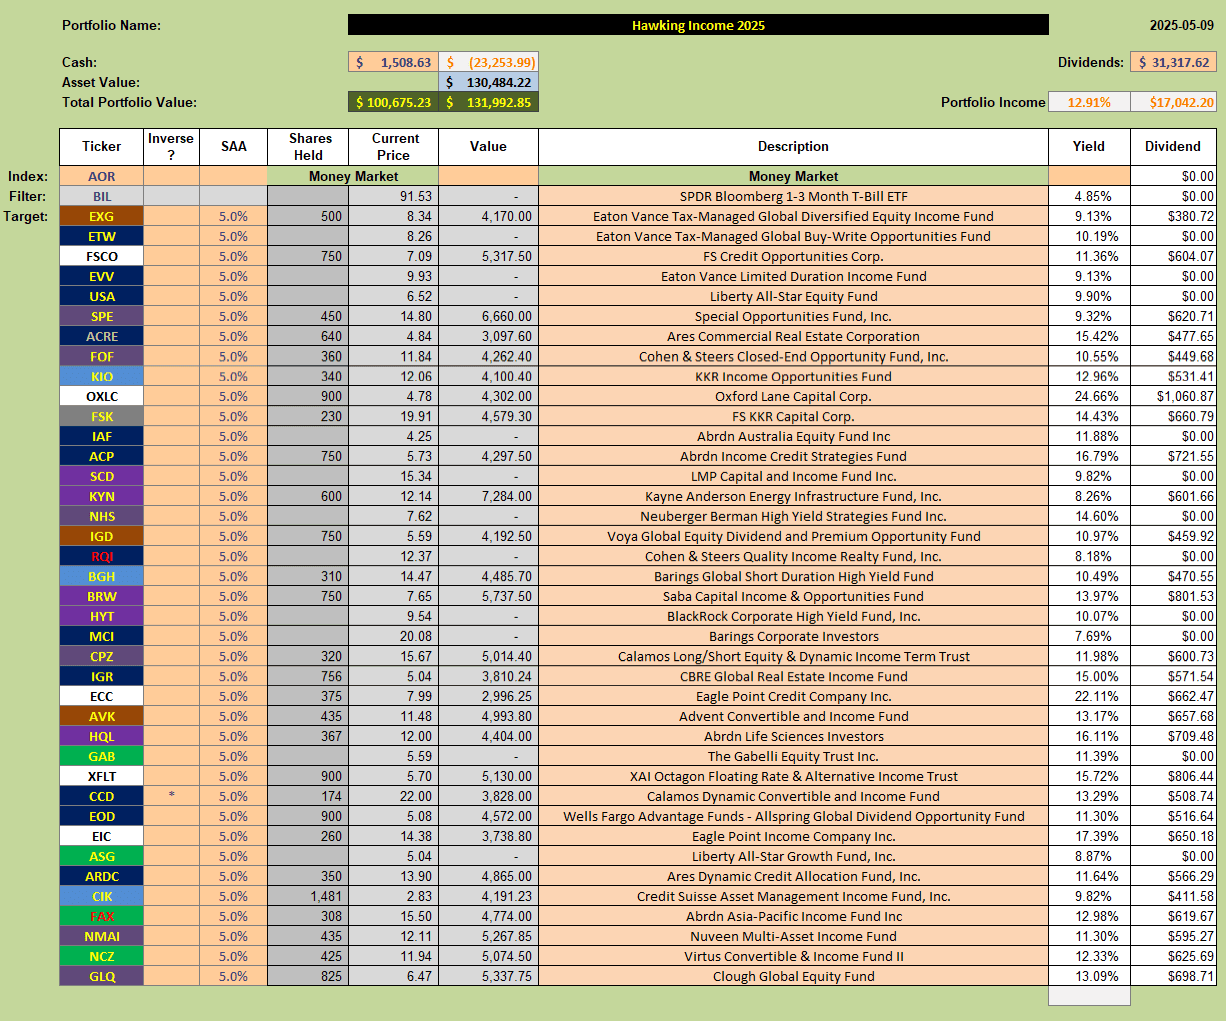 with the addition of one new fund (FSCO) and the addition of 300 shares to existing holdings in XFLT. Twenty-Eight (28) Funds are now held in the portfolio with these being diversified over a number of different asset classes. Anticipated distributions from these Funds are estimated to be ~12.9% annually – although it has to be remembered that a portion of this might be in the form of Return of Capital if proceeds from Net Investment Income (NII) and Growth are insufficient to cover the distributions. However, to date, the portfolio has outperformed the benchmark AOR Fund by ~10%, or a little over 2% per year since inception in Jan 2021:
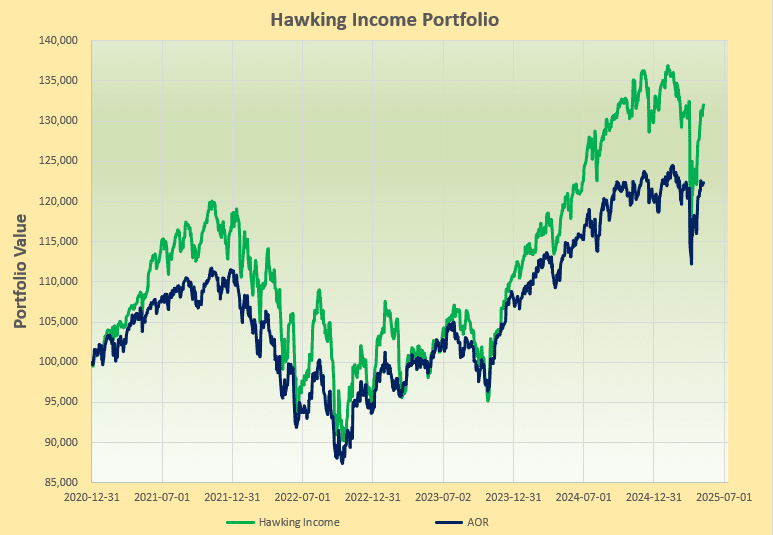
This is a relatively simple “Buy-and Hold” Portfolio requiring a low-level of management and that produces nice returns over time – although it does show a little more volatility than some investors might be comfortable with. Returns to date are at ~30% over the 4.5 years inception that includes 2022 where US equities were down over 20%.
Discover more from ITA Wealth Management
Subscribe to get the latest posts sent to your email.
Given current market uncertainty, (Closed End Funds) CEF’s appear to be a better approach than straight equities for protecting capital. Reducing loss is the context for my questions about the Hawking Portfolio structure and notation. In educating myself about CEF investments:
(a) I am reading Steven Bavaria’s “The Income Factory” [my copy arrived last week]
(b) I recently joined the CEF Connect site, which lists about 400 CEF funds
(c) Additionally, yesterday, I reviewed each of your Hawking items, published here on ITA
I noticed your most recently updated spreadsheet lists 39 CEF type tickers. However, only 28 hold shares, and of those, only 25 are listed on the CEF Connect site. Are the 11 tickers with zero shares items from past selections? Were shares sold but the ticker kept, possibly to be repopulated? Finally, what are your recommended criteria, best practices, and reading references for including a fund within this type of portfolio?
When you have the time, I am looking forward to your reply.
Best Regards,
– Lee
.
Lee,
My apologies for the delay in responding – I missed your comment when posted. I’ve probably answered some of your questions in comments on Lowell’s recent posts on CEFs but, specific to my spreadsheets the 39 tickers are there simply because the spreadsheet is setup for a max of 39 tickers – so I just populate with the max number. I target ~25 CEFs to hold in the portfolio but this might change by +/-2 depending on how much money I have to invest/reinvest from distributions. Normally I treat the assets as “Buy-And-Hold” investments unless, maybe, there is a rights offering, at which point I might sel and consider repurchasing when the Offer has closed. The tickers with zero shares may be past holdings that were closed or, more likely, potential CEFs for future consideration.
I think we’ve covered your question as to where to find data – and there are numerous articles on Seeking Alpha. Apart from Steve Bavaria’s posts I like Nick Ackerman’s posts best – but there are plenty of others too – just do your own due diligence.
David
David,
Thank you, I will check Nick Ackerman’s posts.
All the best,
– Lee
.