
Route 101 along the Oregon Coast.
“The most important key to successful investing can be summed up in just two words-asset allocation.”
– Michael Leboeuf
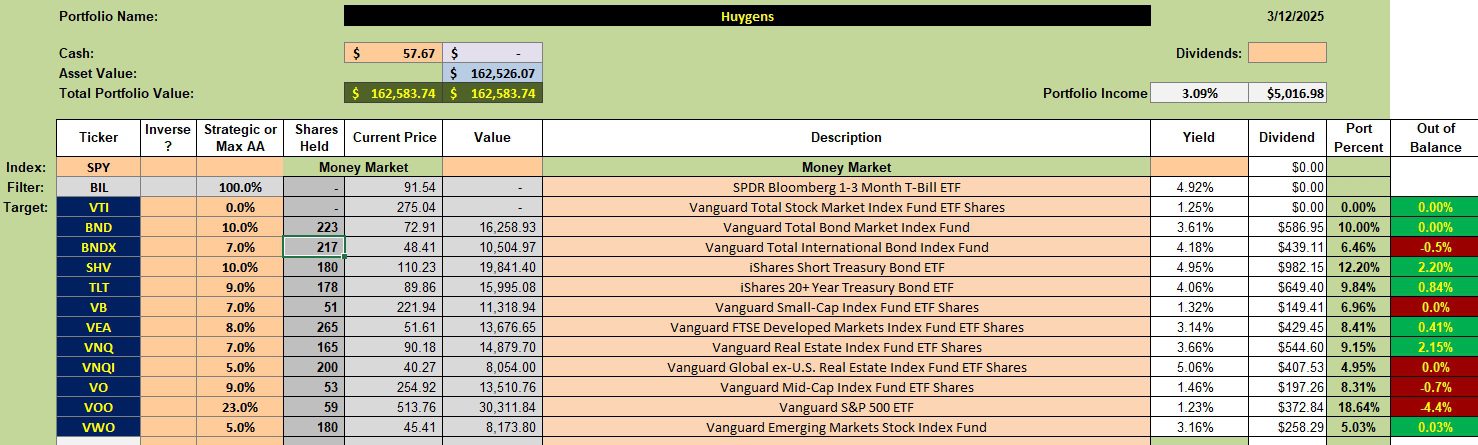
Huygens is the portfolio on tap for an update this morning. This is one of the first portfolios to finally reach the target percentages. Shares of BND and SHV were added this morning so no other adjustments are required at this point. In this volatile market it will be interesting to see what April brings in the way of required rebalancing. The portfolio is now at a point were no selling is required. This is the position I want every Asset Allocation portfolio to be in before summer arrives.
Huygens Asset Allocation Portfolio
Below are the current holdings for the Huygens. Only VOO is significantly out of balance, but we have a model to handle this situation. I’ll go over that procedure in the next screenshot.
Huygens Rebalancing Recommendations
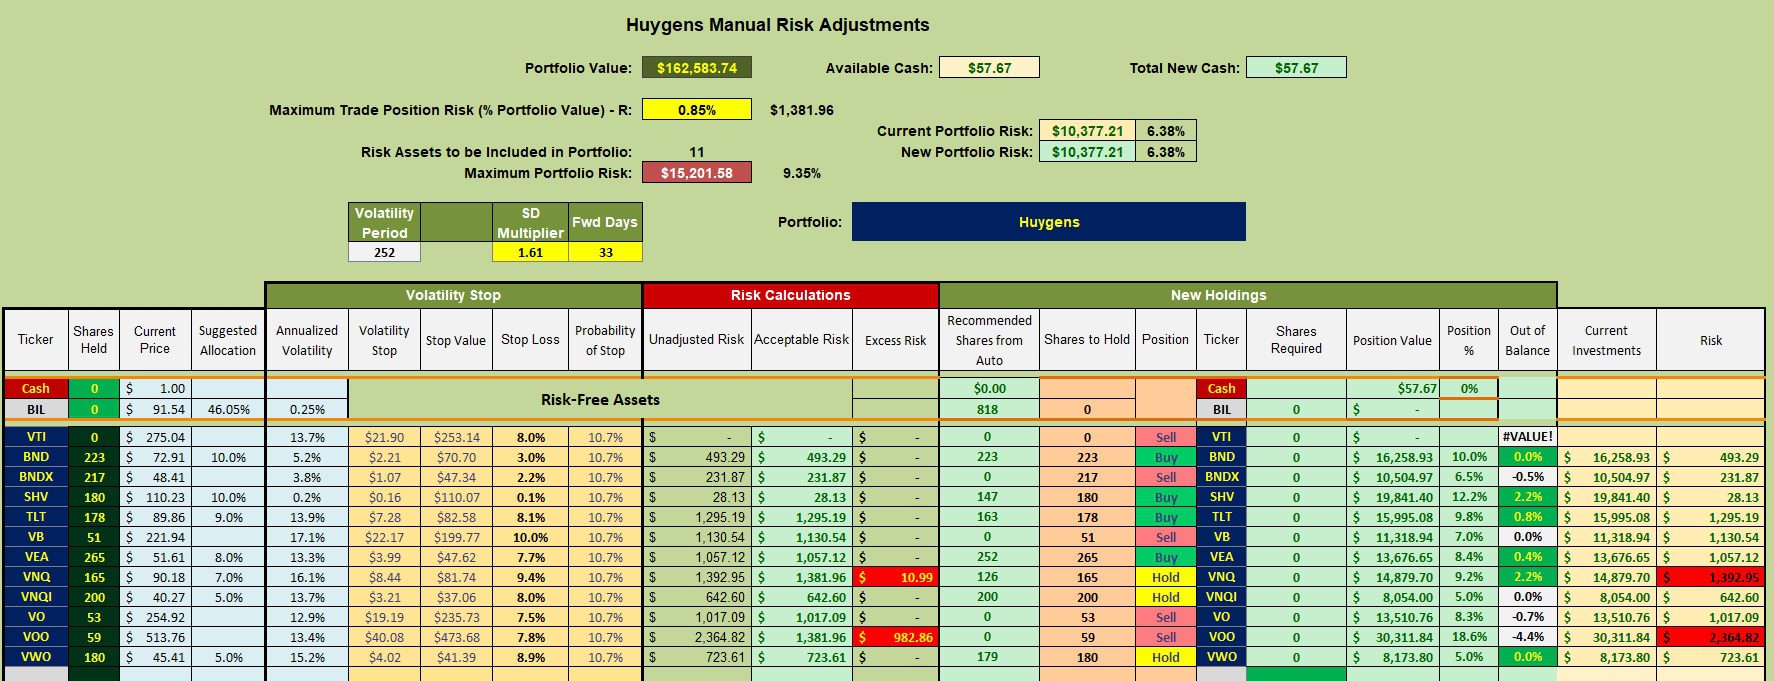
Using the rebalancing model explained in a blog earlier this week, we check the different asset classes. Earlier this morning BND was three shares below target. I added those three shares so BND is now exactly on target.
TLT and VEA are also a BUY. Both are well above target so we do nothing. Let them ride. Asset classes showing up as a Sell or Hold are also neglected at this point. This worksheet from the Kipling spreadsheet is not recommending we add shares to those ETF under target.
After rebalancing BND there was a considerable amount of cash available. Rather than leaving the cash in the money market where the return is quite low, I used all the cash to purchase shares of SHV where the current interest rate is 4.95%.
Assume in April one or more ETFs currently showing a Sell or Hold flips to a Buy. If there is insufficient cash to bring that asset class into balance shares of SHV will be sold to raise the necessary cash. From this point on, only shares of SHV will be sold to keep the other asset classes in balance.
If readers have any questions related to the rebalancing process, post them in the Comment section provided below.
Huygens Performance Data
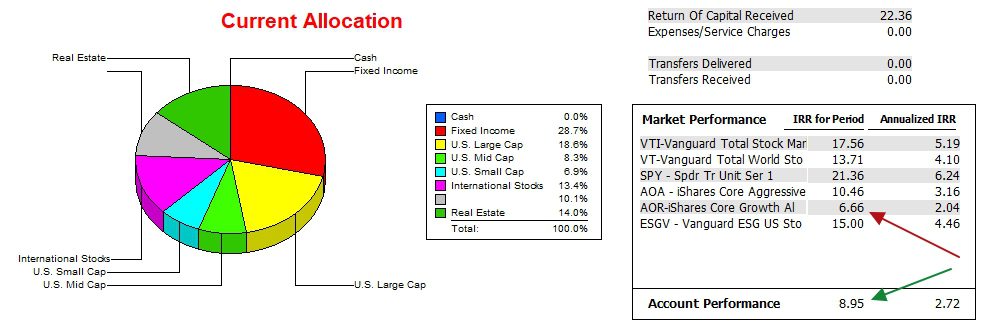
Since 12/31/2021 the Huygens holds a modest lead over AOR.
Huygens Risk Ratios
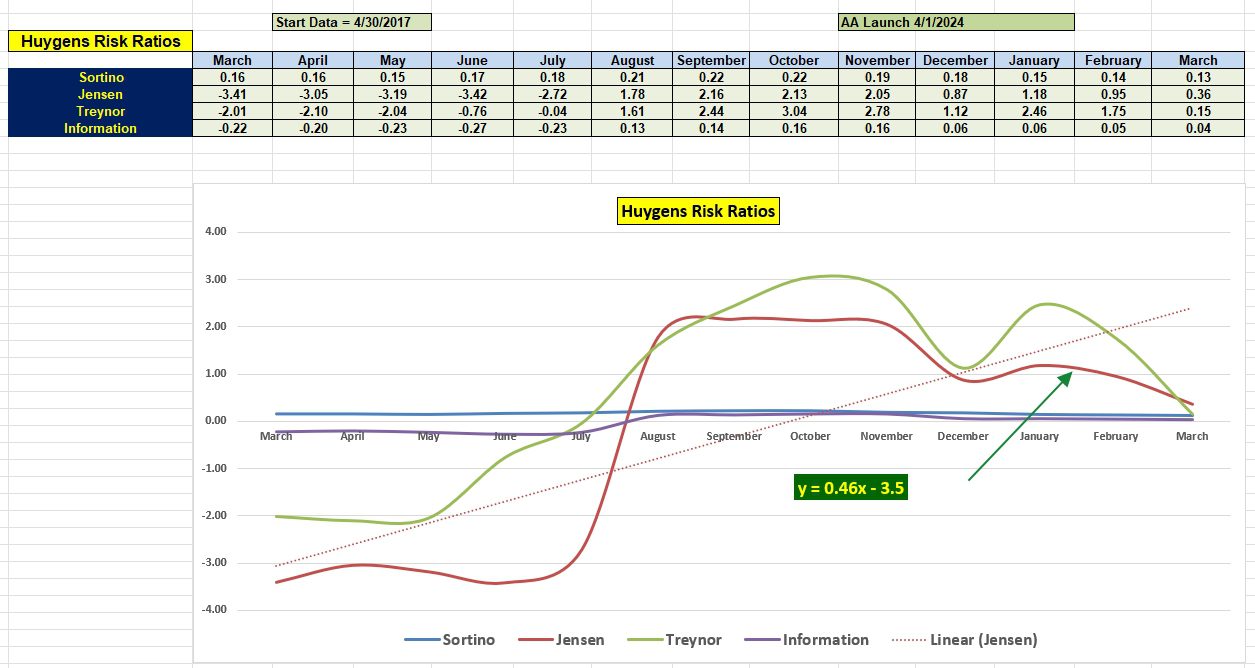
Based on the Jensen Alpha ratio, the Huygens portfolio is a little more volatile than the AOR benchmark. Market declines since the November election show the Huygens dipping faster than the AOR ETF.
Now that the Huygens is in balance we will have a better understanding of how this portfolio matches up with its benchmark going forward.
Once we clear July the very low Jensen numbers will drop out of the slope calculation giving a better understanding as to how risk is playing within the Huygens.
Share the ITA blog site with your friends and family. This site is now free to all readers.
Discover more from ITA Wealth Management
Subscribe to get the latest posts sent to your email.
You must be logged in to post a comment.