
Looking for something in white?
Millikan is the portfolio up for review this morning. Since no sectors are positioned in the oversold zone we concentrate on how best to use cash by analyzing the three U.S. Equity ETFs, VTI, VOO, and ESGV. Some investors might want to broaden the equity options to include developed international equities (VEA) and emerging market equities (VWO). Thus far I’ve made the decision to stick with three U.S. Equities.
Millikan Securities
Below is the investment quiver and current holdings of the Millikan Sector BPI portfolio. Shares of VHT were sold this morning leaving fewer sector ETFs in the Millikan. What to do with the $15,000 in cash will be explained in the next screenshot.

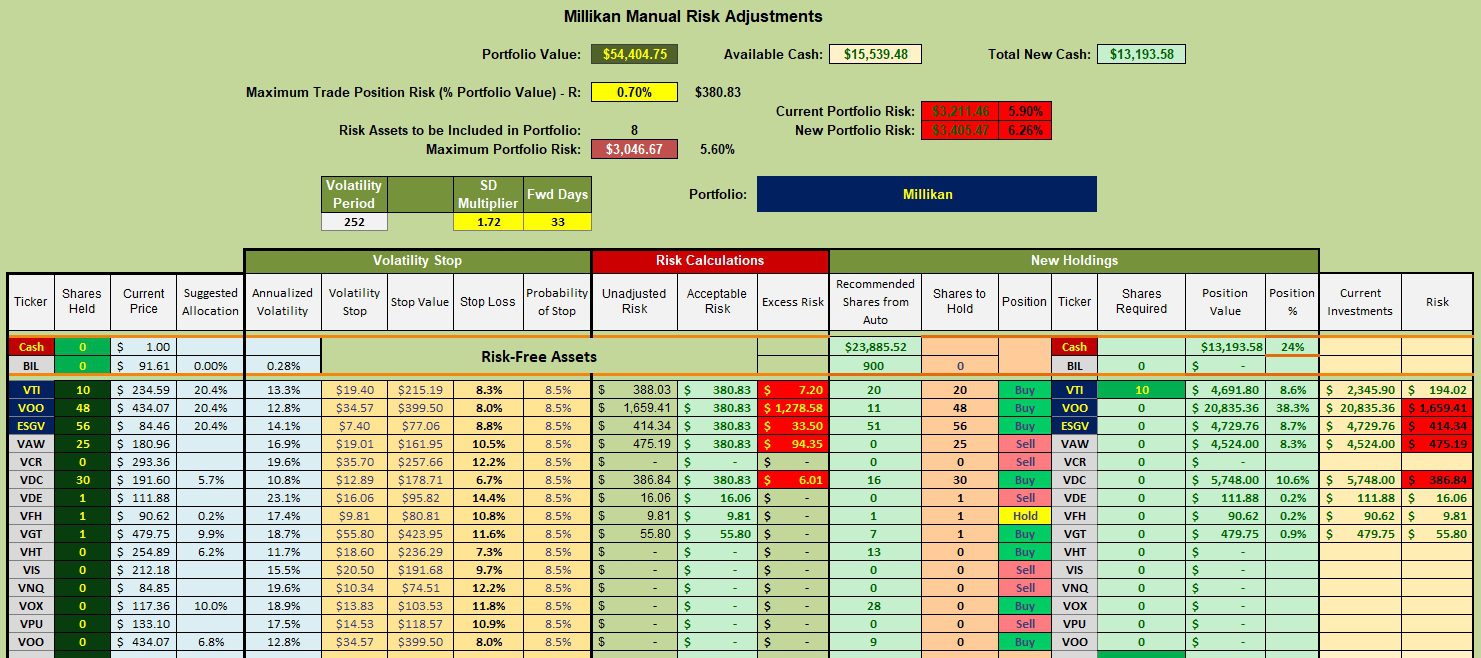
Millikan Manual Risk Adjustments
I should have readjusted the SD Multiplier as I see the Stop Loss value for VTI is above 8.0%. It is still sufficiently close when combined with the 5.6% Maximum Portfolio Risk.
The Kipling spreadsheet (renamed Millikan for this account) recommendation is to beef up VTI another 10 shares. The Millikan currently holds 10 and the Kipling recommends holding 20. This still leaves over $13,000 in cash. Check the upper right-hand figure. When this occurs I set more limit orders for the three U.S. Equity ETFs. These limit orders range from a few percent below current price to as low as 15% below the current price.
If you check the fifth column from the left in the table below you see the three-year annualized volatility is not far off 15%. Sometime in 2024 we can anticipate VTI, for example, will drop over 10%.
Millikan Performance Data
Over the past 24.5 months the Millikan is besting the SPY benchmark by three percentage points. Note that I state three percentage points, not by three percent. There is a difference. Any amount above the benchmark begins to make a difference as one can see by comparing the IRR for Period values. Benchmarks such as AOA and AOR fall further behind.

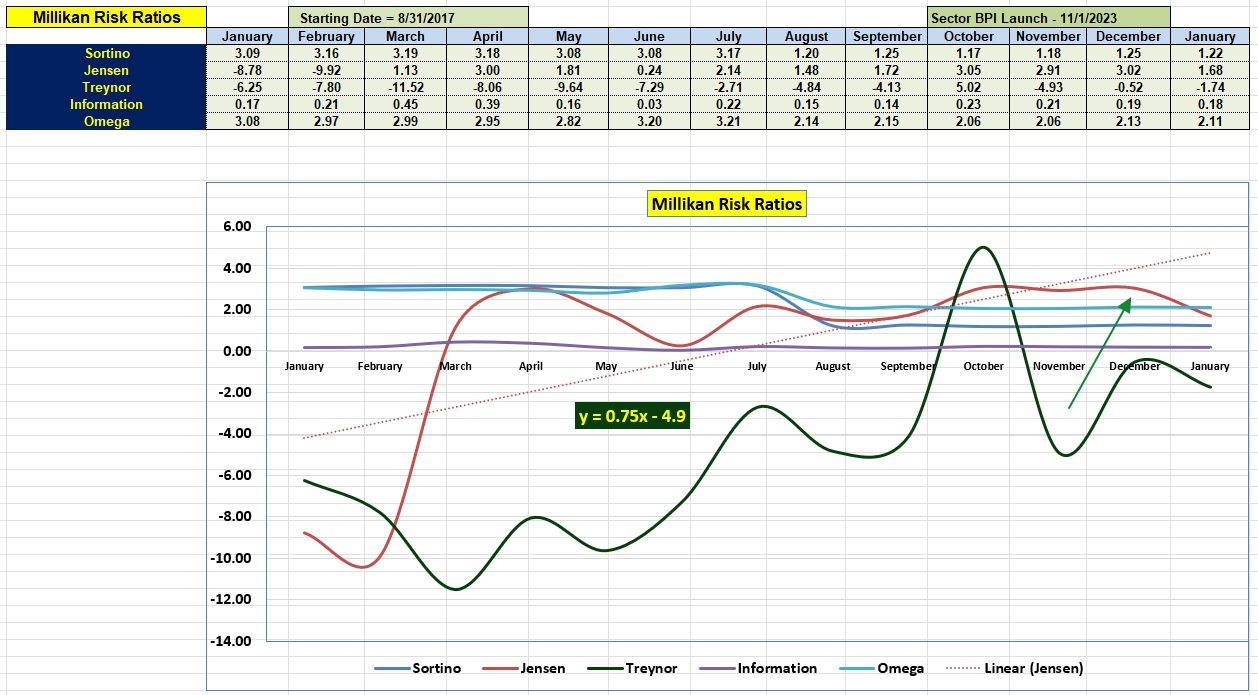
Millikan Risk Ratios
How well is the Millikan performing when risk enters the equation? The Jensen is still positive, but it did drop a considerable amount since the December calculation. Over this past year the Jensen slope is positive, due in large part to the two low values back in January and February of 2023.
The Information is holding steady. Overall, the Millikan reflects good news for the Sector BPI investing model.
Yesterday I received notification the Schrodinger was rebalanced so I plan to post a review of that basic portfolio tomorrow.
Discover more from ITA Wealth Management
Subscribe to get the latest posts sent to your email.
You must be logged in to post a comment.