
Watercolor of Thistle sailing on the Willamette River.
If you checked either the Forum or a comment under the latest Bullish Percent Indicator post you found the latest move among the sectors that make up the U.S. Equities market. The sector in question is identified in the analysis of the Pauling so follow along as I walk through this February review.
Pauling Investment Quiver and Current Holdings
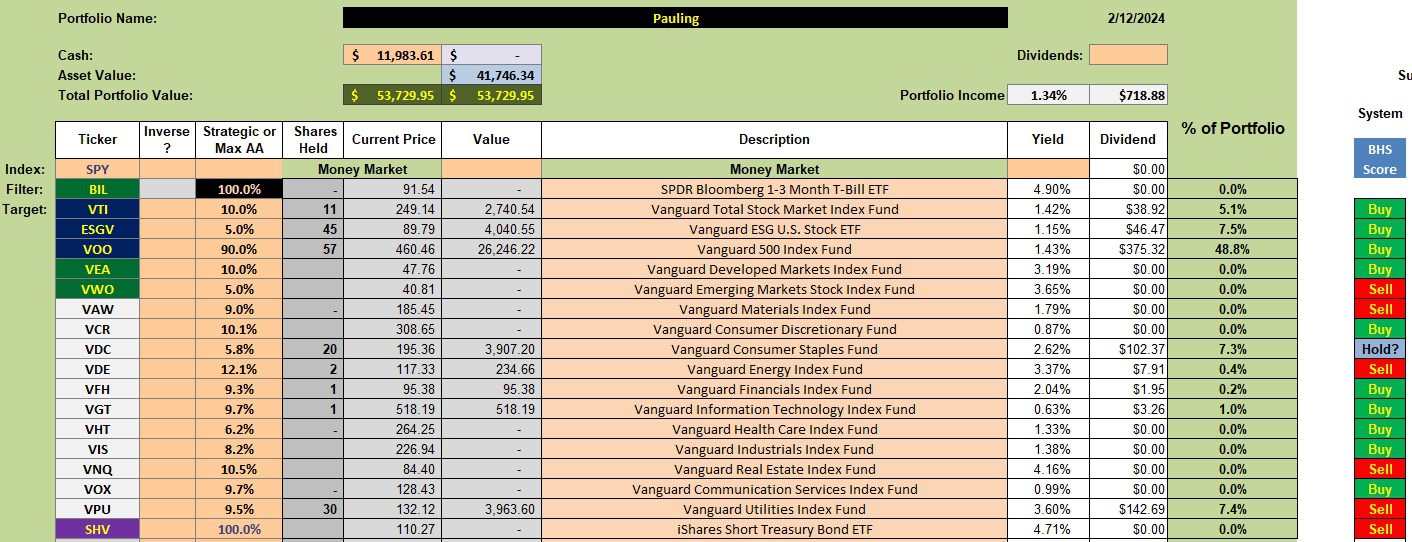
Several changes were made in the investment quiver of the Pauling.
- I added VEA and VWO for additional diversity.
- Thirty (30) shares of VPU were purchased this morning as the Utilities sector dipped into the oversold zone based in the current Bullish Percent Indicator (BPI) readings. This is the first oversold sector we have seen in several months so take note.
Since the last review VAW and VOX were sold out of the Pauling as both securities penetrated the 3% TSLO.
The recommended percentage Utilities (VPU) is to hold is 9.5%. The current percentage is 7.4% so I have a limit order in place to boost the percentage to a little above 9.5%.
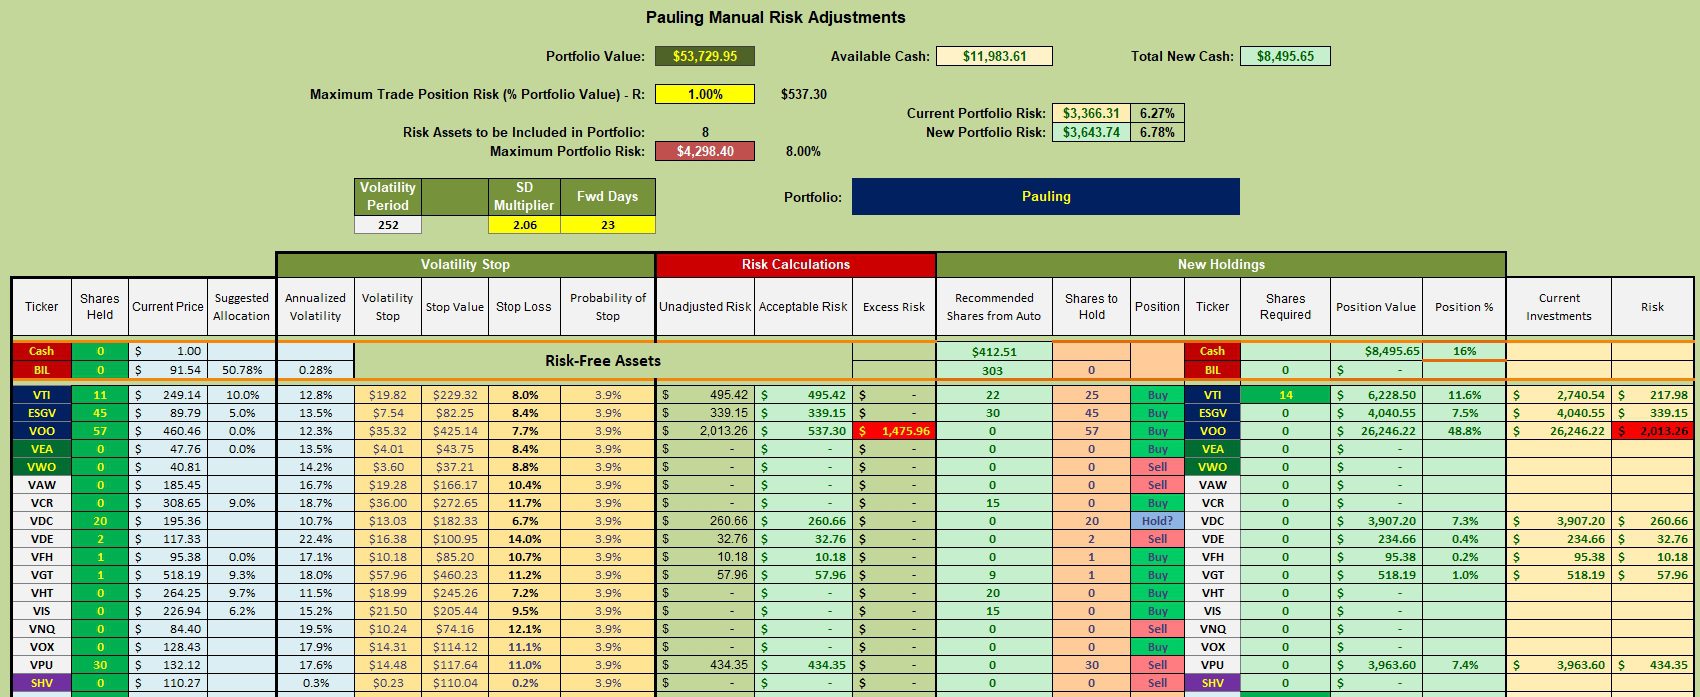
Pauling Manual Risk Adjustments
A limit order is also in place to move VTI up to the 25 share recommended limit. Yes, the recommendation is 22, but I round up to the nearest five shares when cash is abundant.
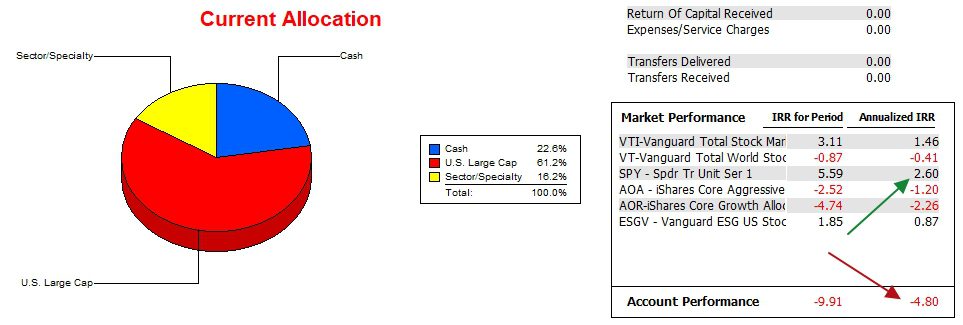
Pauling Performance Data
The Pauling continues to lag the S&P 500 (SPY) benchmark since 12/31/2021. In fact it is lagging all the possible benchmarks. Keep in mind that the Pauling was off to a slow start and has only been using the Sector BPI model since sometime in October of 2023.
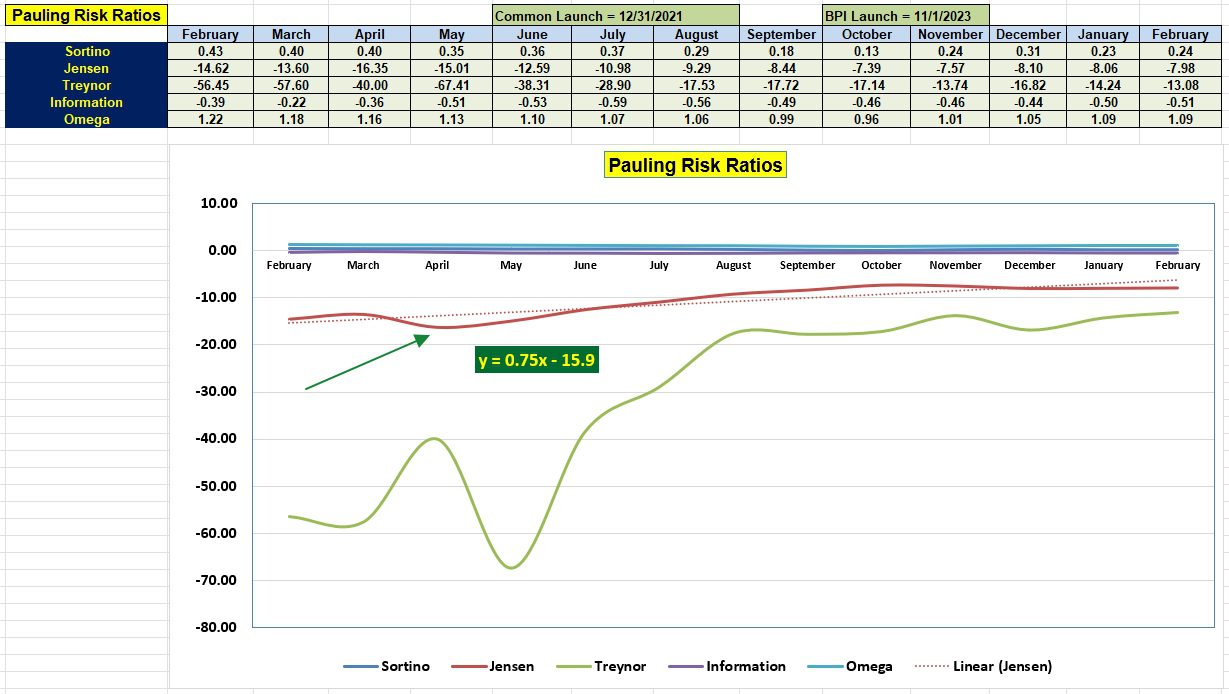
Pauling Risk Ratios
The Jensen Alpha value improved since December of 2023, but lost ground to the critical Information Ratio. There is a high correlation between these two risk measurements.
It is encouraging to see a strong slope for the Jensen, but that too is likely to modify once we clear the next three to four months.
Pauling Portfolio Record
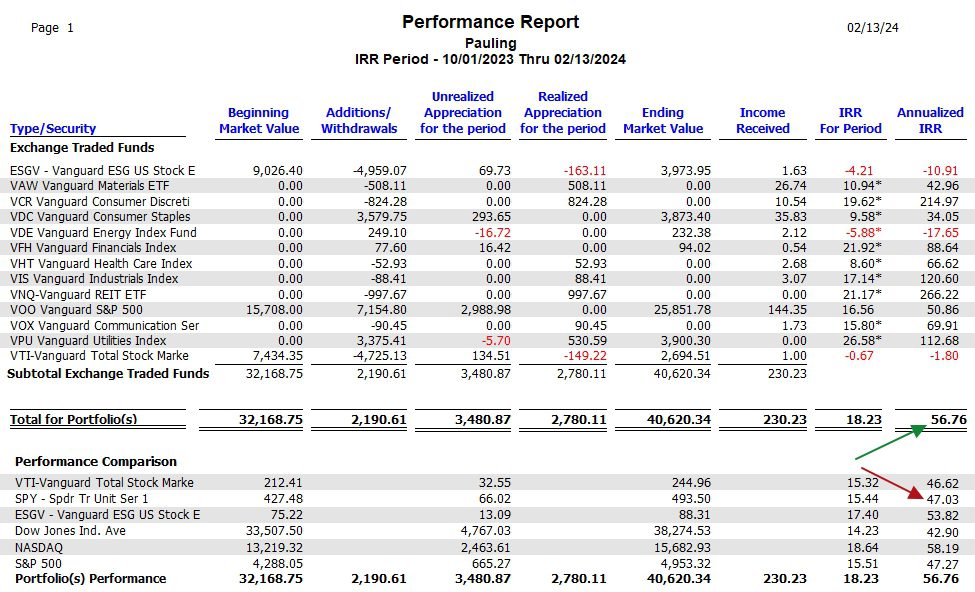
The first sector ETFs were purchased in October of 2023. Since then we see where the IRR values outperformed the SPY benchmark. That is the goal and the following data table is used as a reference to analyze the Sector BPI investing model. Thus far it is working despite the loss from the Energy sector (VDE).
Note: I just noticed that VGT is not included. That is an oversight on my part. That sector was one of the better performing sectors.
Comments are always welcome.
Discover more from ITA Wealth Management
Subscribe to get the latest posts sent to your email.
You must be logged in to post a comment.