
Forgotten Oregon
Even though limited transactions are planned, I am going to walk through a complete analysis of the Huygens as it has been some time since I’ve done so with any of the Sector BPI portfolios. Huygens is new to the Sector BPI investing model so pay attention to trends vs absolute values. The Sector BPI investing model has only been used with the Huygens a little over a month so this is an infant Sector BPI portfolio.
Huygens Investment Quiver and Holdings
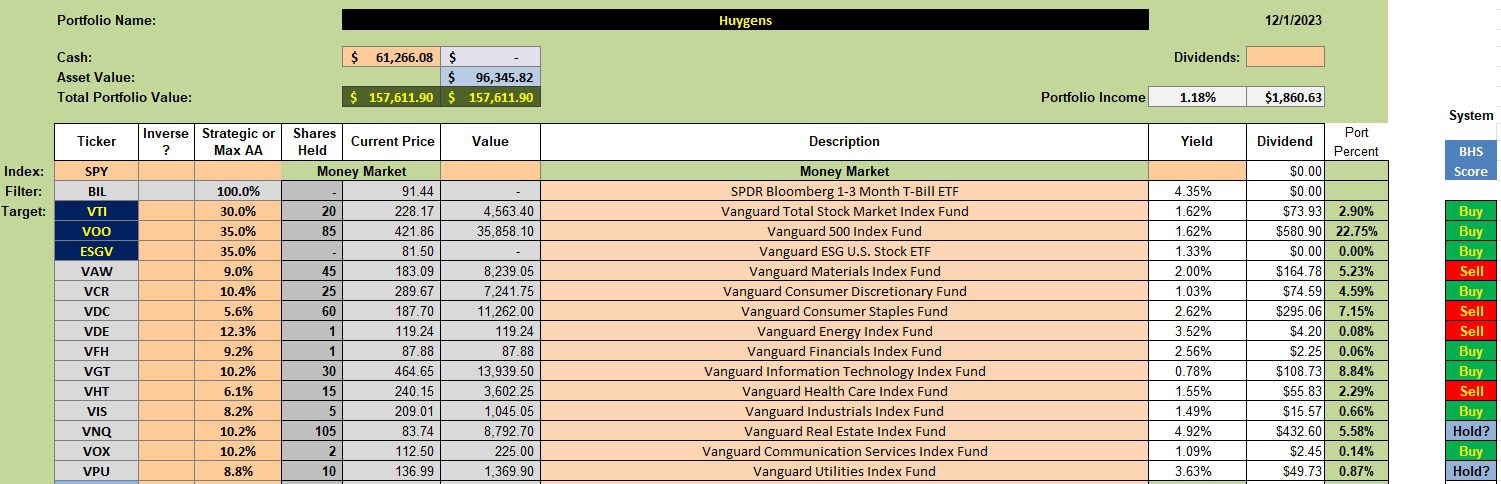
Below are the current holdings for the Huygens. As readers can see, the portfolio is holding considerable percentage in cash as I missed several limit orders. This is the problem with setting limit orders vs purchasing at market.
If a sector was a Buy over the past month, as Materials (VAW) was, the percentage to be invested is listed in the third column from the left and the actual percentage of the portfolio is provided in the Port Percent column over on the right. Materials is well under the recommended percentage.
Based on the most recent BPI data, Financial, Technology, Utilities, and Real Estate sectors are set with TSLOs as all four are currently overbought.
Huygens Security Recommendations
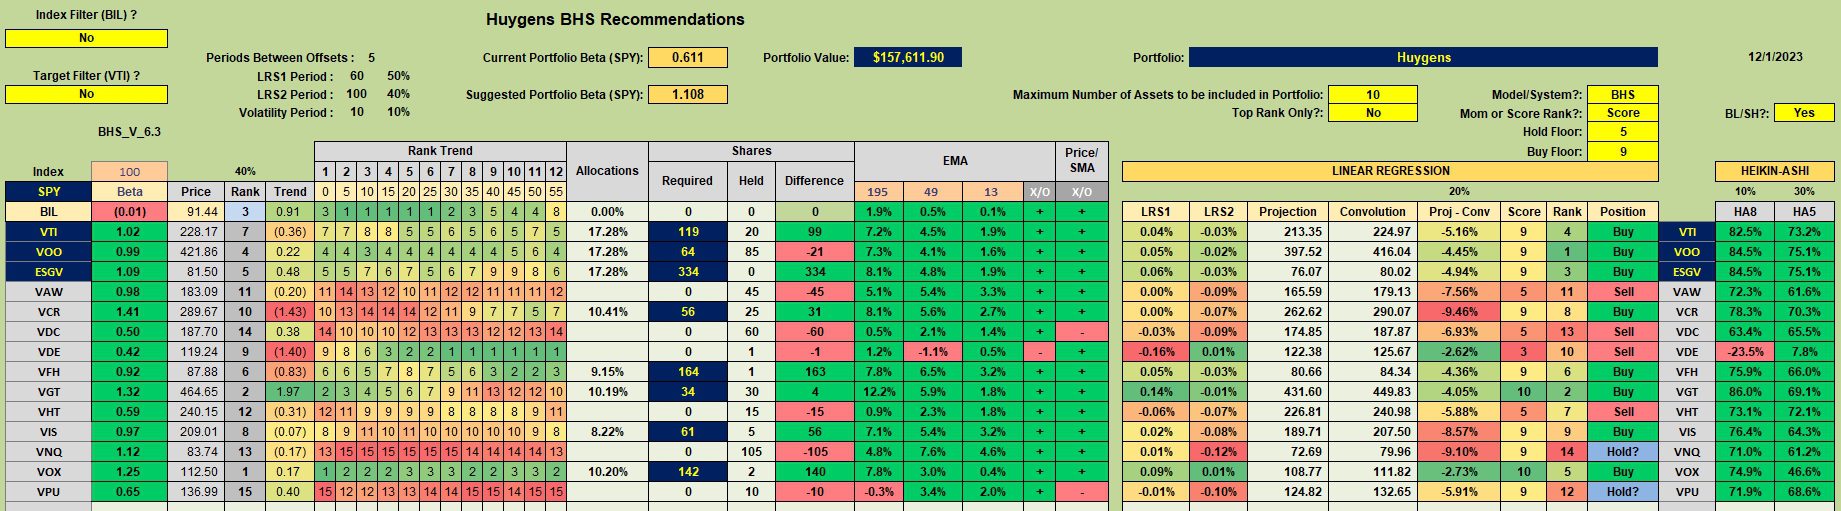
When using the BHS system and the 60- and 100-trading days look-back period we have all three U.S. Equity ETFs (VTI, VOO, and ESGV) showing up as a Buy. Based on BPI data no sector ETFs are recommended for purchase. Therefore I look to the U.S. Equities as a place to invest available cash. Since VOO is ranked number one (1) I have several limit orders in place to purchase more shares of VOO. I do not indicate this move or plan in the third screenshot.
Huygens Manual Risk Adjustments
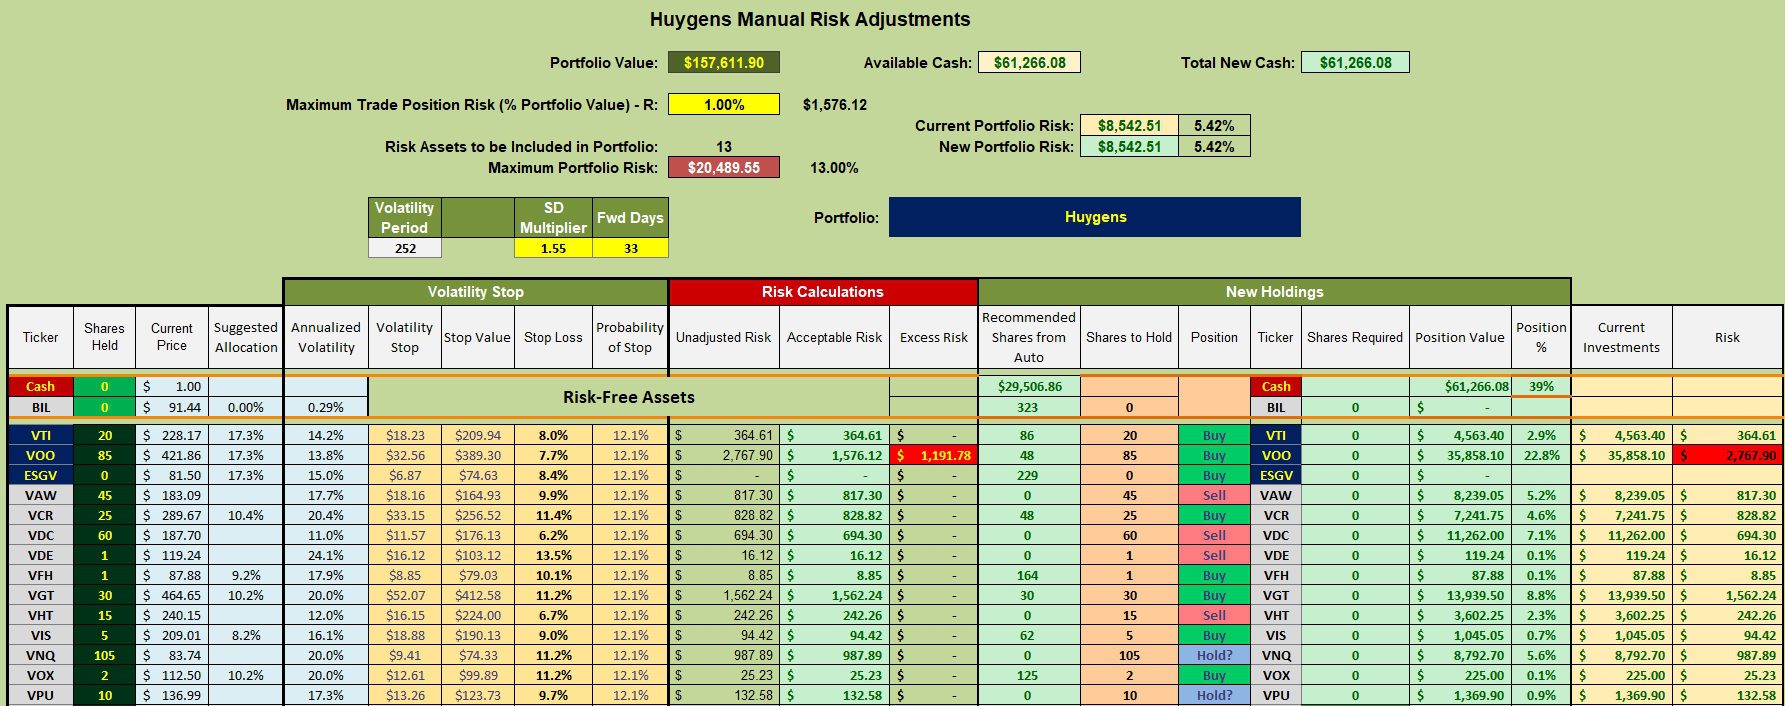
No plans are in place to purchase more sector ETFs as none are oversold. As mentioned above, I have several limit orders in place to pick up more shares of VOO. I’m content to hold some cash as I feel sure there are going to be buying opportunities next year.
Huygens Performance Data
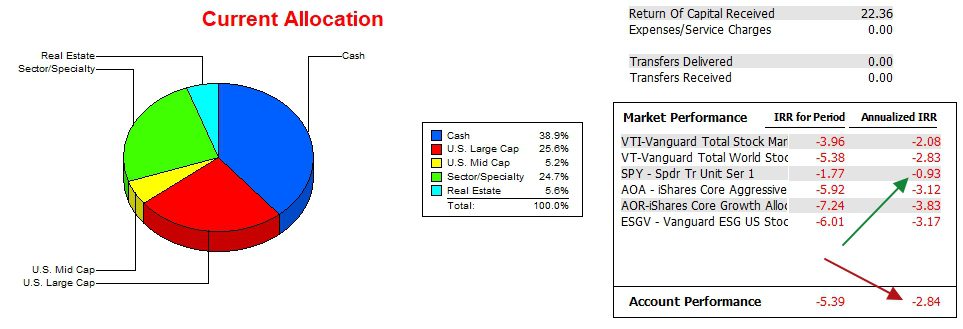
How has the Huygens performed over the past 23 months? As the arrows indicate, the Huygens continues to trail the S&P 500 (SPY) and it is in a dead heat with Vanguard’s Total Market ETF, VT. Of note is that the portfolio is outperforming ESGV, AOA, and AOR over this 23 month period.
Huygens Risk Ratios
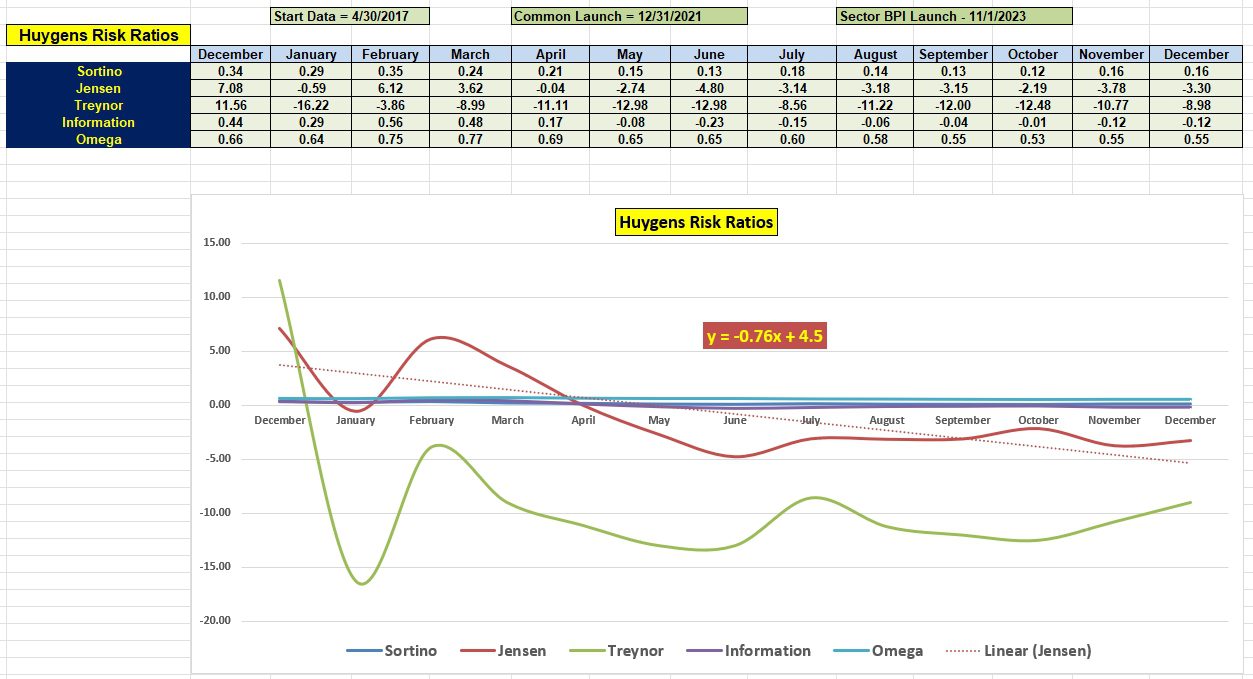
The Jensen slope improved since last month as we dropped off a high value. Further improvement will show up next month when the December 2023 value vanishes.
It is still very early in December so don’t pay too much attention to the data in the far right column. The November 2023 data would be even better had I not missed several limit order as November was an outstanding month for U.S. Equities.
Huygens Sector Performance Data
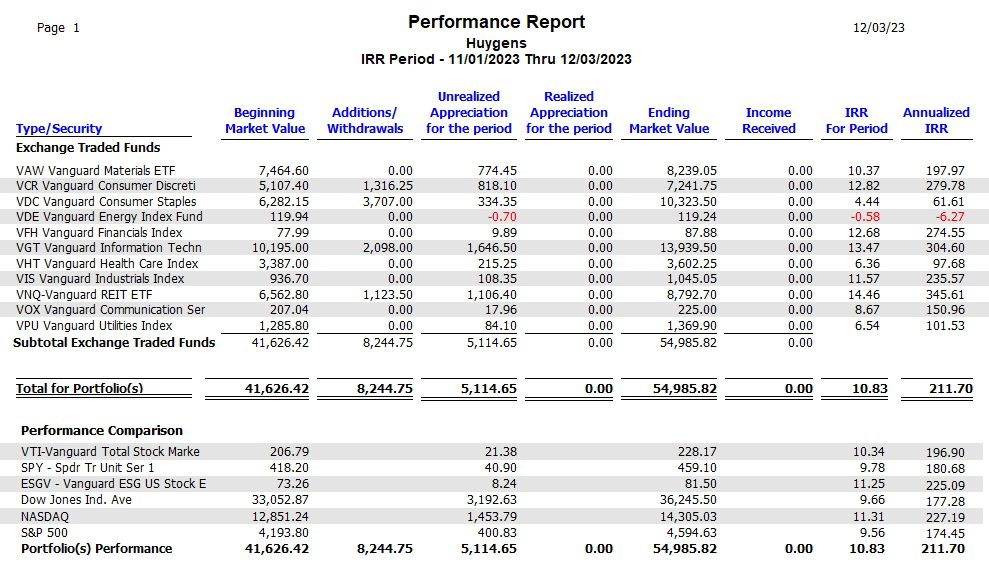
Before looking at the following data, please note that the information is covering a very short period. I’m posting it so readers can see how the different ETFs that are part of Huygens are performing vs. the S&P 500. Over this short period SPY rose an annualized 180.7% or an actual gain of 9.8%. The sector ETFs that were part of the Huygens rose an annualized 211.7% or an actual 10.8%. At least the sectors are keeping pace with the SPY ETF.
Caution: Again, this data covers a very short period so limit any potential excitement.
Here are links to other portfolios using the Sector BPI model and a few links to the model in general.
Gauss Portfolio Update: 19 March 2023
Millikan Sector BPI Update: 20 July 2023
Franklin Portfolio Review: 21 July 2023
Tweaking Sector BPI Plus Investing Model: Part II
Tweaking Sector BPI Plus Model: 20 May 2023
Discover more from ITA Wealth Management
Subscribe to get the latest posts sent to your email.
You must be logged in to post a comment.