
California Mission – Grunge Look
Since there are no purchase recommendations and all the appropriate TSLOs are in place, this is a quick update of the Pauling to check on the direction of the portfolio. Is the portfolio moving in the right direction? In other words, is the Sector BPI investing model help or hindering the Pauling?
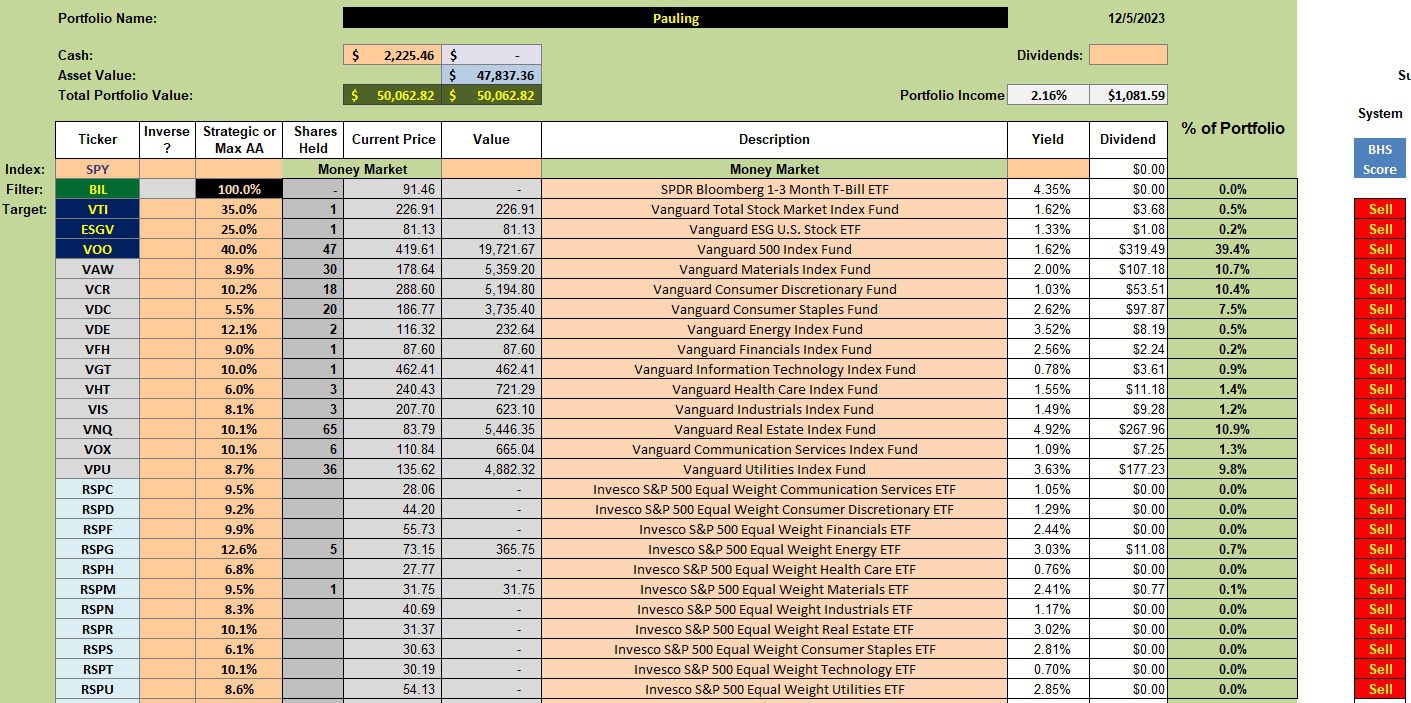
Pauling Security Holdings
I’ve expanded the investment quiver to include equal weight ETFs. Those are the securities that begin with the ticker letters RSP. The next time a sector Buy recommendations shows up I will compare the five-year performance records of both the cap-weighted and equal-weighted ETFs and purchase the better performer. Eventually the Pauling will end up with a mixture of the different weight ETFs.
If there are questions about equal-weight, just ask in the Comment section.
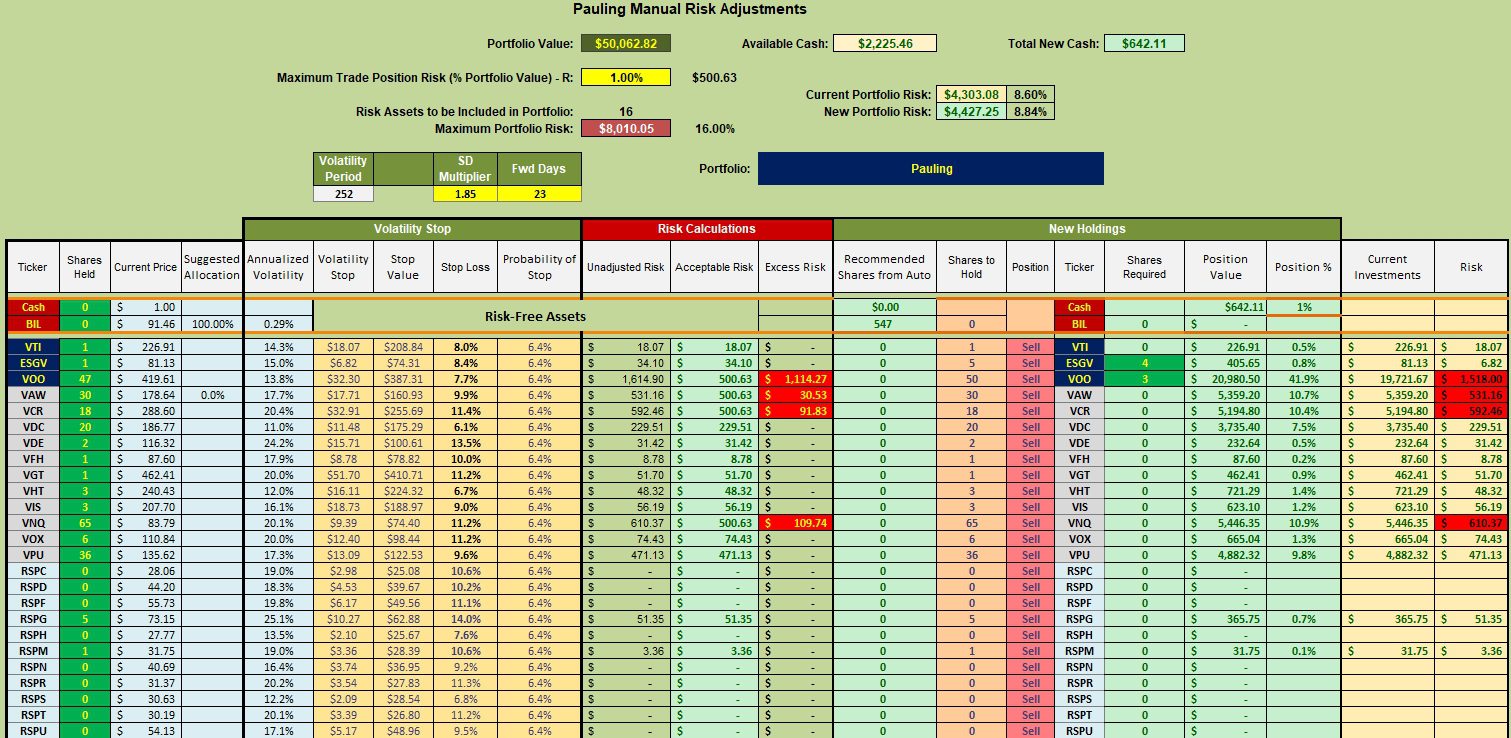
Pauling Manual Risk Adjustments
Since no sectors are recommended for purchase I will use the available cash to pick up shares of ESGV and VOO. These are the two highest ranked U.S. Equity ETFs at the moment.
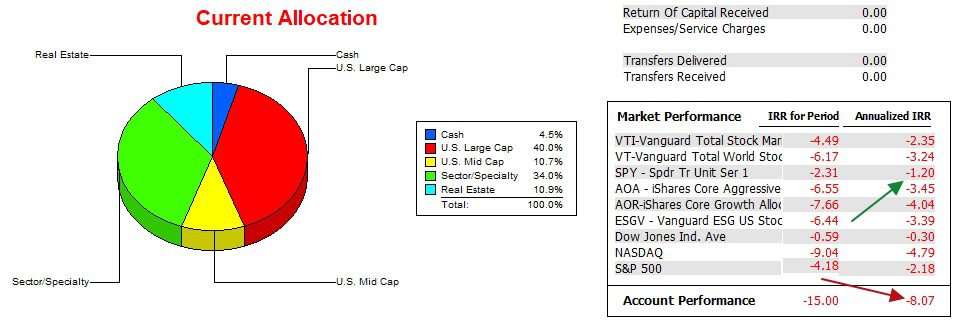
Pauling Performance Data
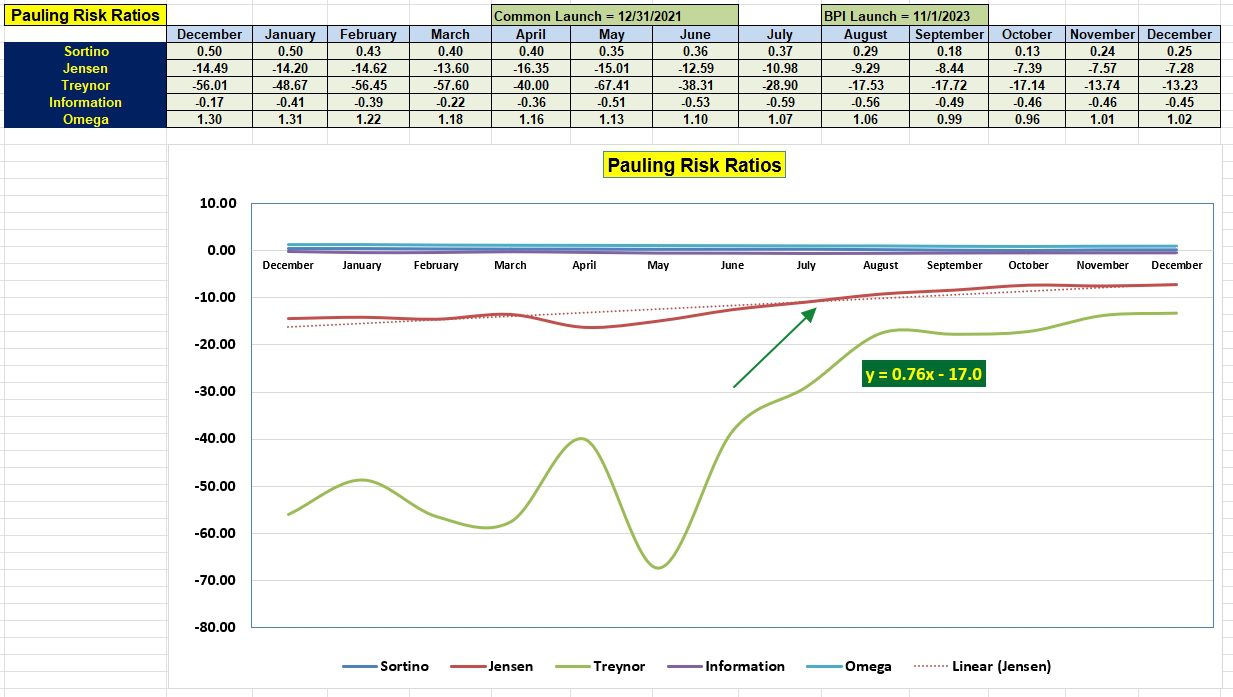
For many months the Pauling has been lagging the S&P 500. This is still true after 23 plus months of operation. We need to move to the Risk Ratios table to see what direction the portfolio is moving. Keep in mind the Pauling is new to the Sector BPI investing model.
Pauling Risk Ratios
The first positive signal is the slope (+0.76) of the Jensen Alpha calculation. Over the past year the Jensen Performance Index has improved and that is holding true for these first few days of December.
The Information Ratio is moving in the right direction these last few months. We will know a lot more after a full year of operating using the Sector BPI investing model. Since the Pauling is new to the sector model we cannot attribute these positive directions to this model. That will need to wait several months.
Look to the Carson for more historical data on the Sector BPI investing model.
Discover more from ITA Wealth Management
Subscribe to get the latest posts sent to your email.
Lowell,
Looks as if VIS is in the sell range 73+%.
Bob W.
Bob,
Correct. In my most recent Forum post I mentioned that VIS or Industrials is a sell.
Lowell
Lowell,
3% on the TSLO?
Bob
Bob,
Yes, I set a 3% TSLO.
Lowell
Hi Lowell
Is there a simple explanation for the advantage of equal weight vs cap weight ETFs? The RSP_ ETFs all carry a 0.40% expense ratio vs the 0.10% for the Vanguard ETFs and the SPDR ETFs some of which have better 5yr records.
Bob
Bob P.,
There are a few sectors where small- and mid-cap stocks perform better, relatively speaking, than large-cap stocks. Rob Arnott is one of the strong advocates for equal-weight ETFs.
What I intend to do is wait for a sector to be oversold, and when this happens, compare the 5-year performance (or longer if data is available) between the ETFs and go with the better performing ETF.
While I much prefer lower expense ratios, I will go with the better performing ETF. In the final analysis, it might not make much difference.
Lowell
Lowell
Thanks, I agree with low expense ratios and better performance. I am still trying to consider Asset Allocation in my portfolio choices so I am now adding some sectors. Most sectors are in the large categories of Value Core & Growth. Of course, VNQ is a in the Real-estate cat.
Bob
Bob,
I’m also a huge fan of the Asset Allocation investing model. The Schrodinger is such a model. I’ve not found the major asset allocation divisions among StockChart BPI data. Do you know if StockCharts provides BPI data for mid-cap value, large-cap growth, etc. as examples? If such breakdowns were available among the StockChart data I would develop portfolios around Asset Allocations in addition to the Sector BPI portfolios now in operation.
Lowell
LOWELL
I don’t see any specific BPI data for asset classes. However, I found this on Stock Charts:
” you could build your own Bullish Percent Index by adding a known number of symbols to a ChartList and scanning to see how many symbols have collectively crossed above or below a specific threshold….” .
I presume we need to be a paying member to do this. Plus we would need to determine which symbols to use for each.
for example, VTV (Large Value) has over 340 companies according to Morningstar. Sounds like a HUGE job.
BOB
Bob,
I am not up to constructing my own Asset Allocation BPI system. It would be a LOT of work. I’ll stick with the sector model.
Lowell