
Bronte Harbour, Oakville, Ontario
This week saw a small ~0.25% pullback in US Equity markets (S&P 500 Index) but we are still consolidating at the ~6500 level:
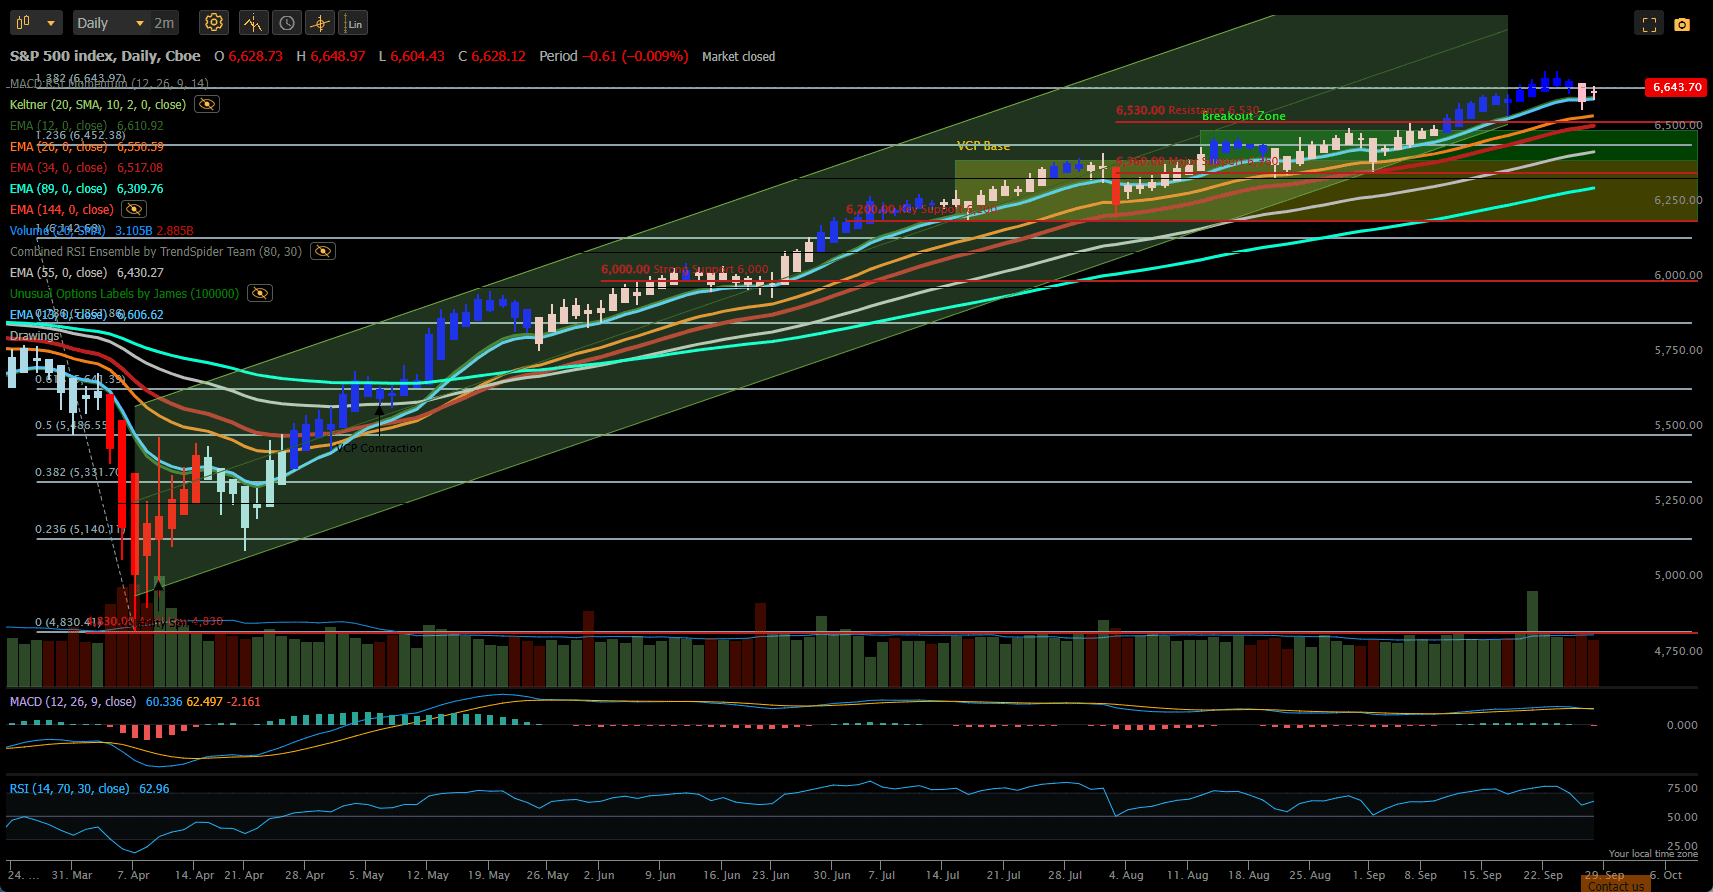
All Exponential Moving Averages (EMAs) are sloping upwards and stacked in bullish formation so we are still in a confirmed upward trend and we have seen no evidence of the historical September weakness/under-performance. The only cautionary message from the above chart is that we have conflicting signals from the MACD and RSI momentum indicators with the MACD sending a bearish signal but with the RSI remaining in bullish territory without being overbought (a potential bearish warning sign of possible mean reversion with RSI>70).
Compared with other major asset classes:
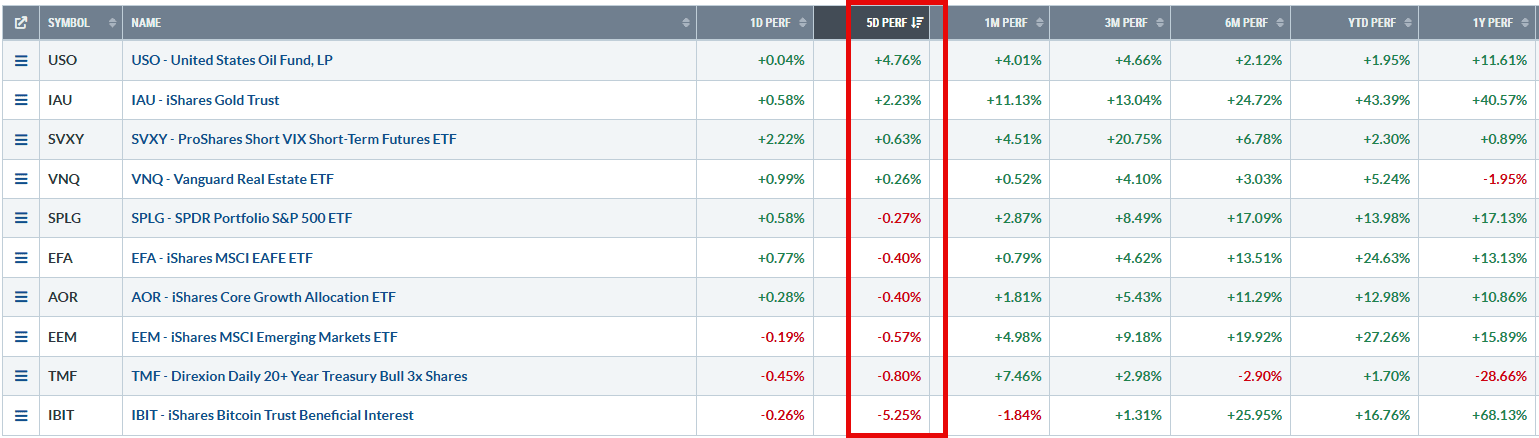 US equities remain in the centre of the pack with defensive sectors like Energy/Oil (USO) and Gold leading the way. Crypto was the biggest loser over the past week.
As reported in last week’s review of the Darwin Portfolio I adjusted my equity holdings by selling Bonds (TMF) and Developed Market Equities (EFA) whilst rebalancing Emerging Market Equities (EEM) and adding US Equities:
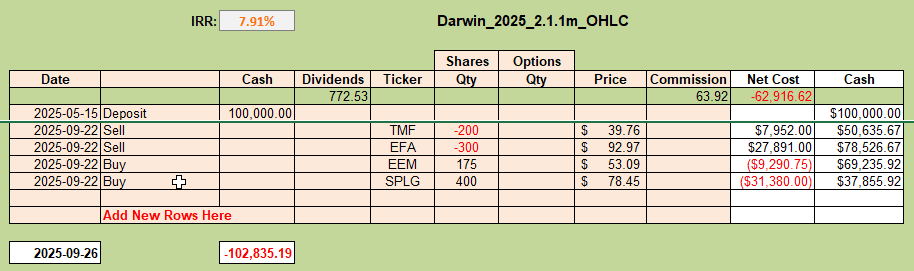 Although I have increased allocations slightly the portfolio is presently still only 60% invested. Performance to date looks like this:
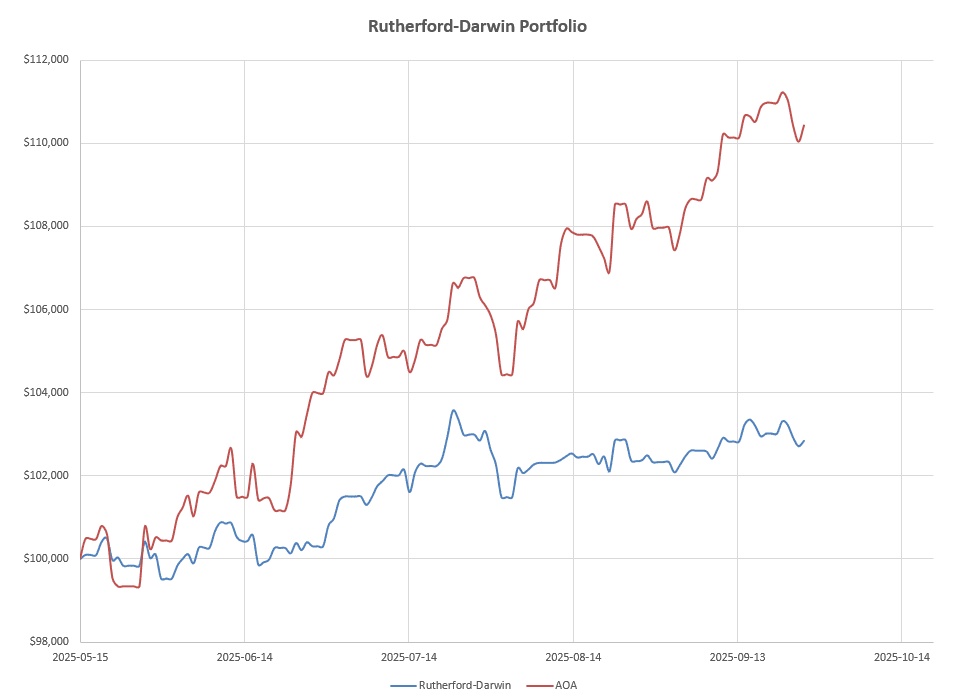 with a 7.9% Internal Rate of Return (IRR) and low 5% volatility.
I am still in the process of moving to a slightly modified rotation system that focuses on trend and momentum – but with slightly more emphasis on trend than in previous models/systems. However, I am still comparing recommendations from both workbooks with the original Kipling BHS workbook showing the following:
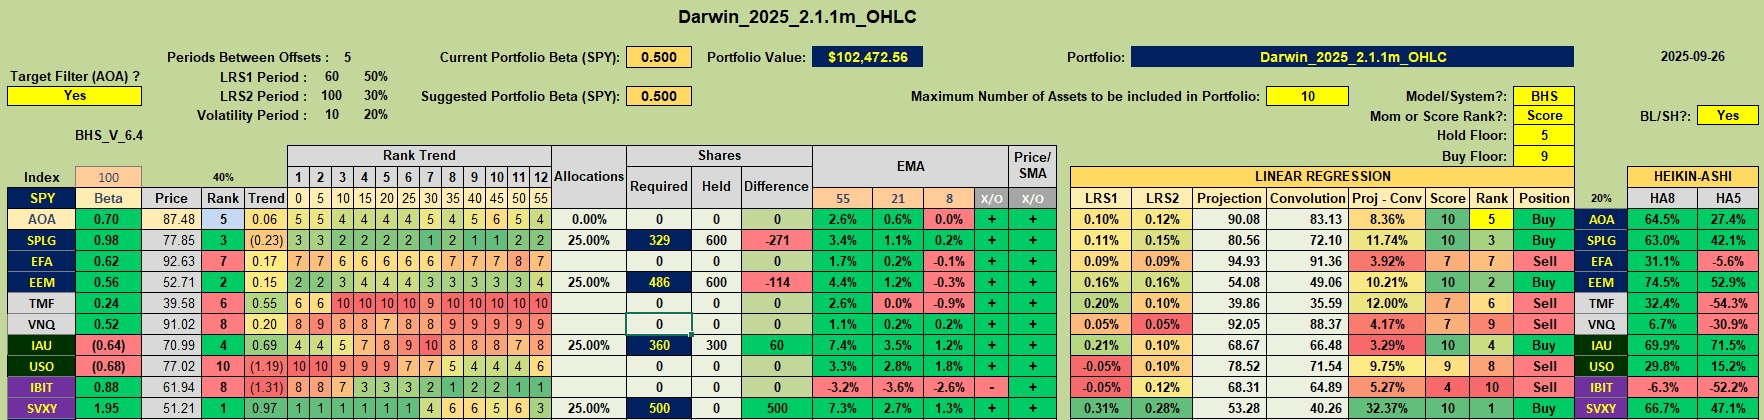 i.e. Buy recommendations for SPLG, EEM and IAU (current holdings) and the benchmark AOA (ignoring the volatility ETF SVXY for now).
This changes only slightly looking at my initial rotation model:
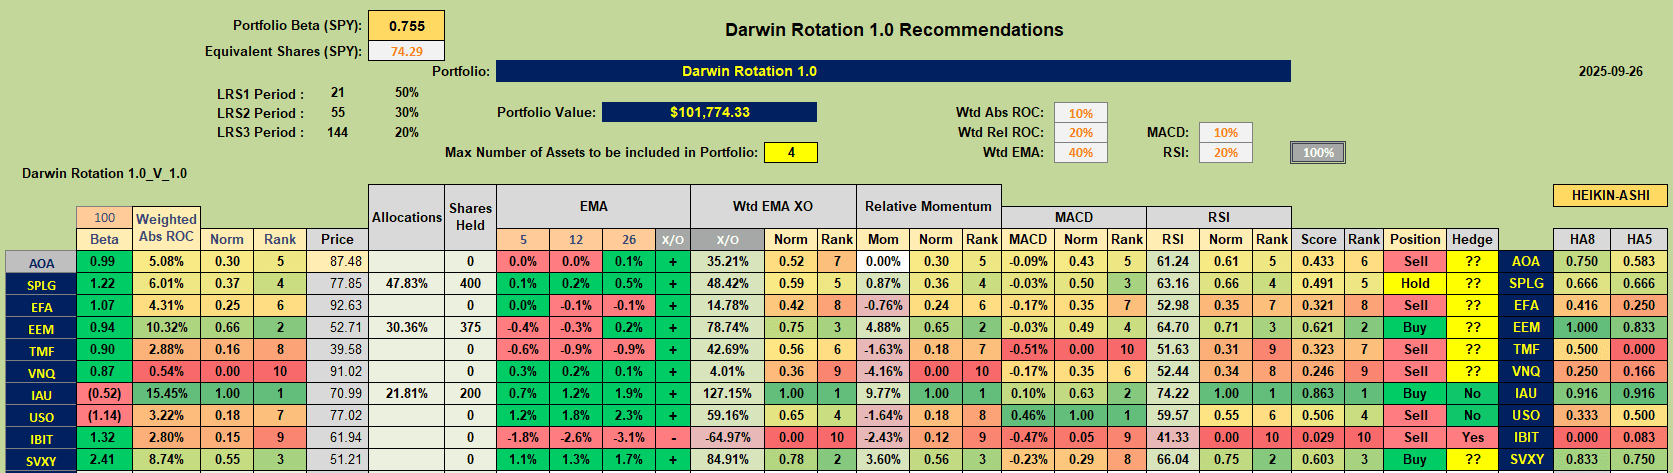 with EEM and IAU remaining as potential Buys and SPLG showing as a Hold. AOA does not quite hit the Buy recommendation mark but is very close.
I am still working on this model with my latest version actually switching the SPLG Hold and EEM Buy recommendations to Sell recommendations and a Buy recommendation on USO (Oil):
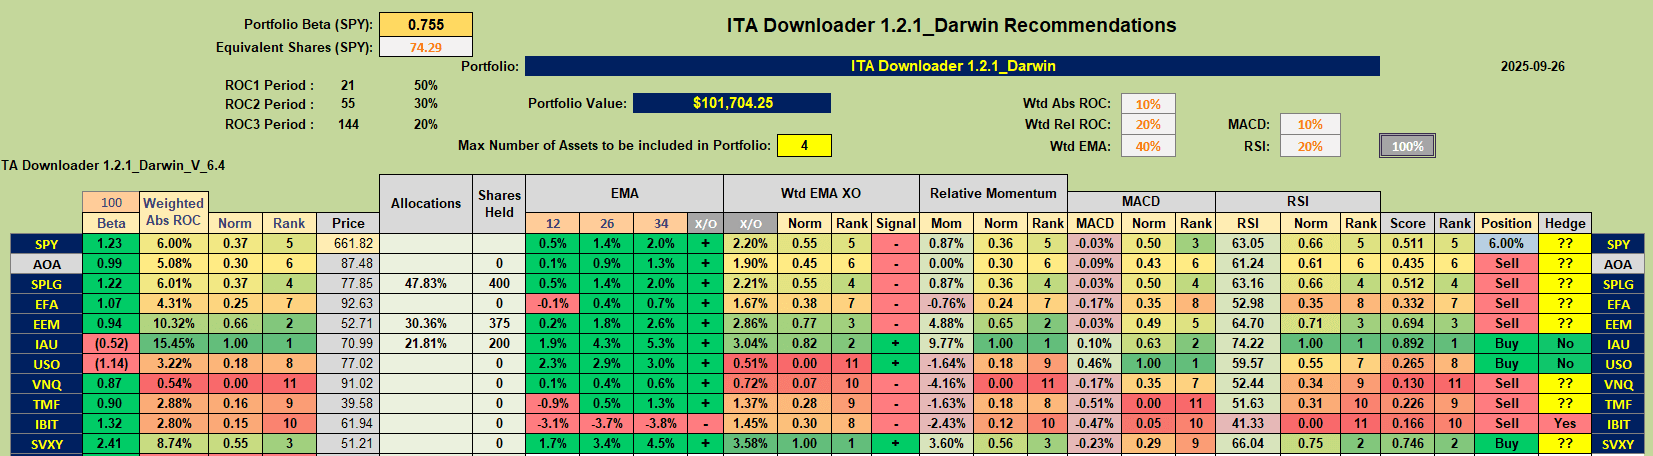 This is due to a heavier weighting/emphasis on trend that generates the following graphs for EEM:
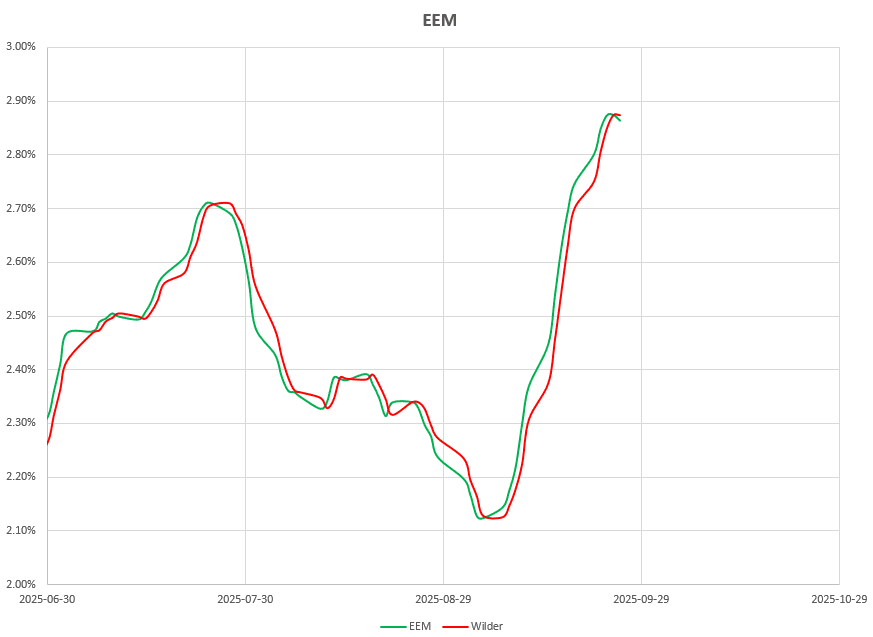 where the green EMA trend signal has just dropped below the red signal line , and USO:
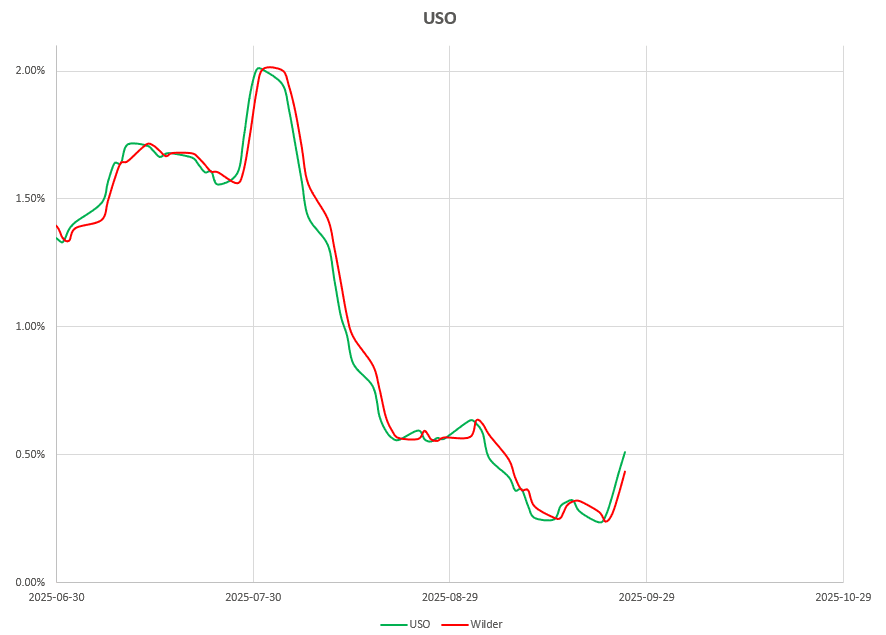
where the EMA signal has moved above the signal line.
For the sake of completeness, the SPLG graph looks like this:
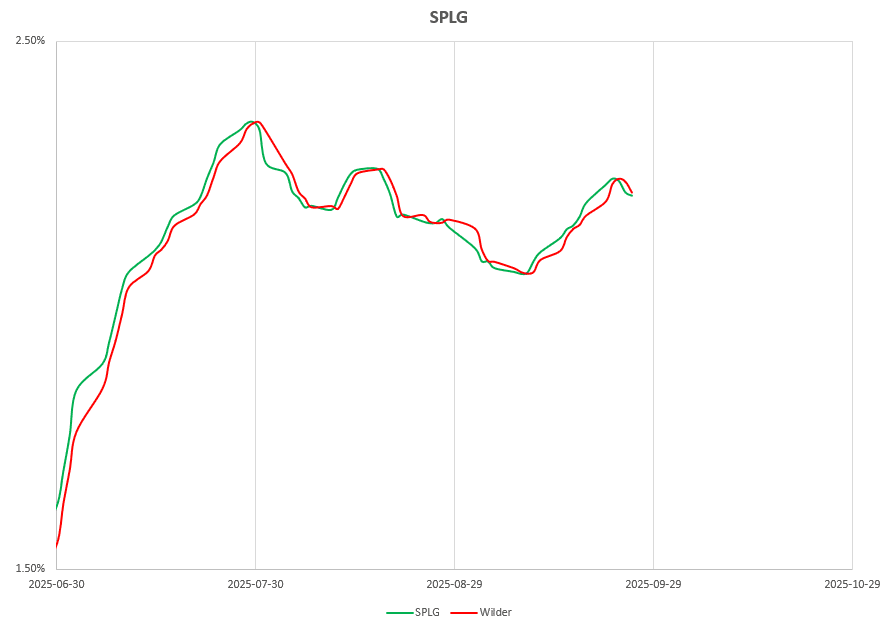
where the trend signal seems to be hesitating having just fallen below the signal line.
As I’ve mentioned in the past I would like to get to the point where, on average, the holding period was at least ~20 days (1 month). I would prefer to trade/adjust as infrequently as possible, but this will obviously be determined by market behavior – although I may be able to hedge the risk of not selling immediately by hedging with Options. These are the more subtle aspects of the system that I am still working on. For now I will be watching these graphs closely and adjusting as I see necessary. At the moment I am unhedged, but this may change in the very short term, and I may be selling Call Options against current holdings. I am still also working on the allocation model and may simplify this – especially if I feel that I may be trading more frequently than I would like until I can comfortably adjust parameters so as to generate less frequent signals. In my latest version of this rotation model I have cut out the shortest period EMA crossovers so that the “fastest” signals now come from the 26-/34-, 26-/55- and 26-/89- period crossovers. At some point I will probably look at the effect of extending the look-back periods beyond 89-periods – maybe to 144- and even 233- periods (~6 to ~12-months).
Since we presently seem to be in a sideways consolidation period I will continue to watch the charts for a possible breakout in either one direction or the other and will adjust accordingly. No strong signals either way at the present time so maybe best to stay diversified – therefore I am most likely to favor adding a position in USO if the signal continues/confirms – even though I am actually feeling bearish on Oil without an obvious (political?) trigger. I missed a great opportunity in SVXY by overriding signals based on my personal feelings about where volatility might go – so I should probably just ignore those views and stick with the system/model until it tells me that I might be right 🙂
Discover more from ITA Wealth Management
Subscribe to get the latest posts sent to your email.
Leave a Comment or Question