
Blacksmiths Shop in Gretna Green, Scotland – where young couples would elope to get married
Although this post is titled “Rutherford Portfolio Review” it is not really a review of the portfolio that I have reported on in the past as I have (officially) closed that portfolio down in order to document how it is possible to manage relatively simple diversified portfolios in different ways. The appeal of a portfolio similar to the Rutherford Portfolio, that has been used to date, lies in the diversity that can be achieved by selecting a few (less than 10) ETFs that cover the major asset classes for investment and have a wide range of correlations between the asset classes. This potentially reduces volatility and may help us sleep better at night. Of course, this may also mean that total returns are not as great as might be achieved through the adoption of a more focussed strategy based on a different benchmark – e.g. a strategy focussed on beating the S&P 500 Index by splitting the equity assets into sectors (health, technology, energy etc) or style (large-, medium- small cap) groups. As we have suggested many times in the past it is difficult to “time” the market and luck weighs heavily on performance. We all have different tolerance for risk – and this changes with time, as we get older, and our “investment horizon” narrows – and there is no universal solution that fits our personal requirements at all times. Diversity in management strategies is just as important and effective as diversification in the selection of assets that we may choose to include in our investment “quiver”.
Before I describe/explain my new “Rutherford” portfolio for 2025 I will just start with my weekly look at the markets. US equities closed the year significantly higher than they started, even though they were showing weakness at the end:
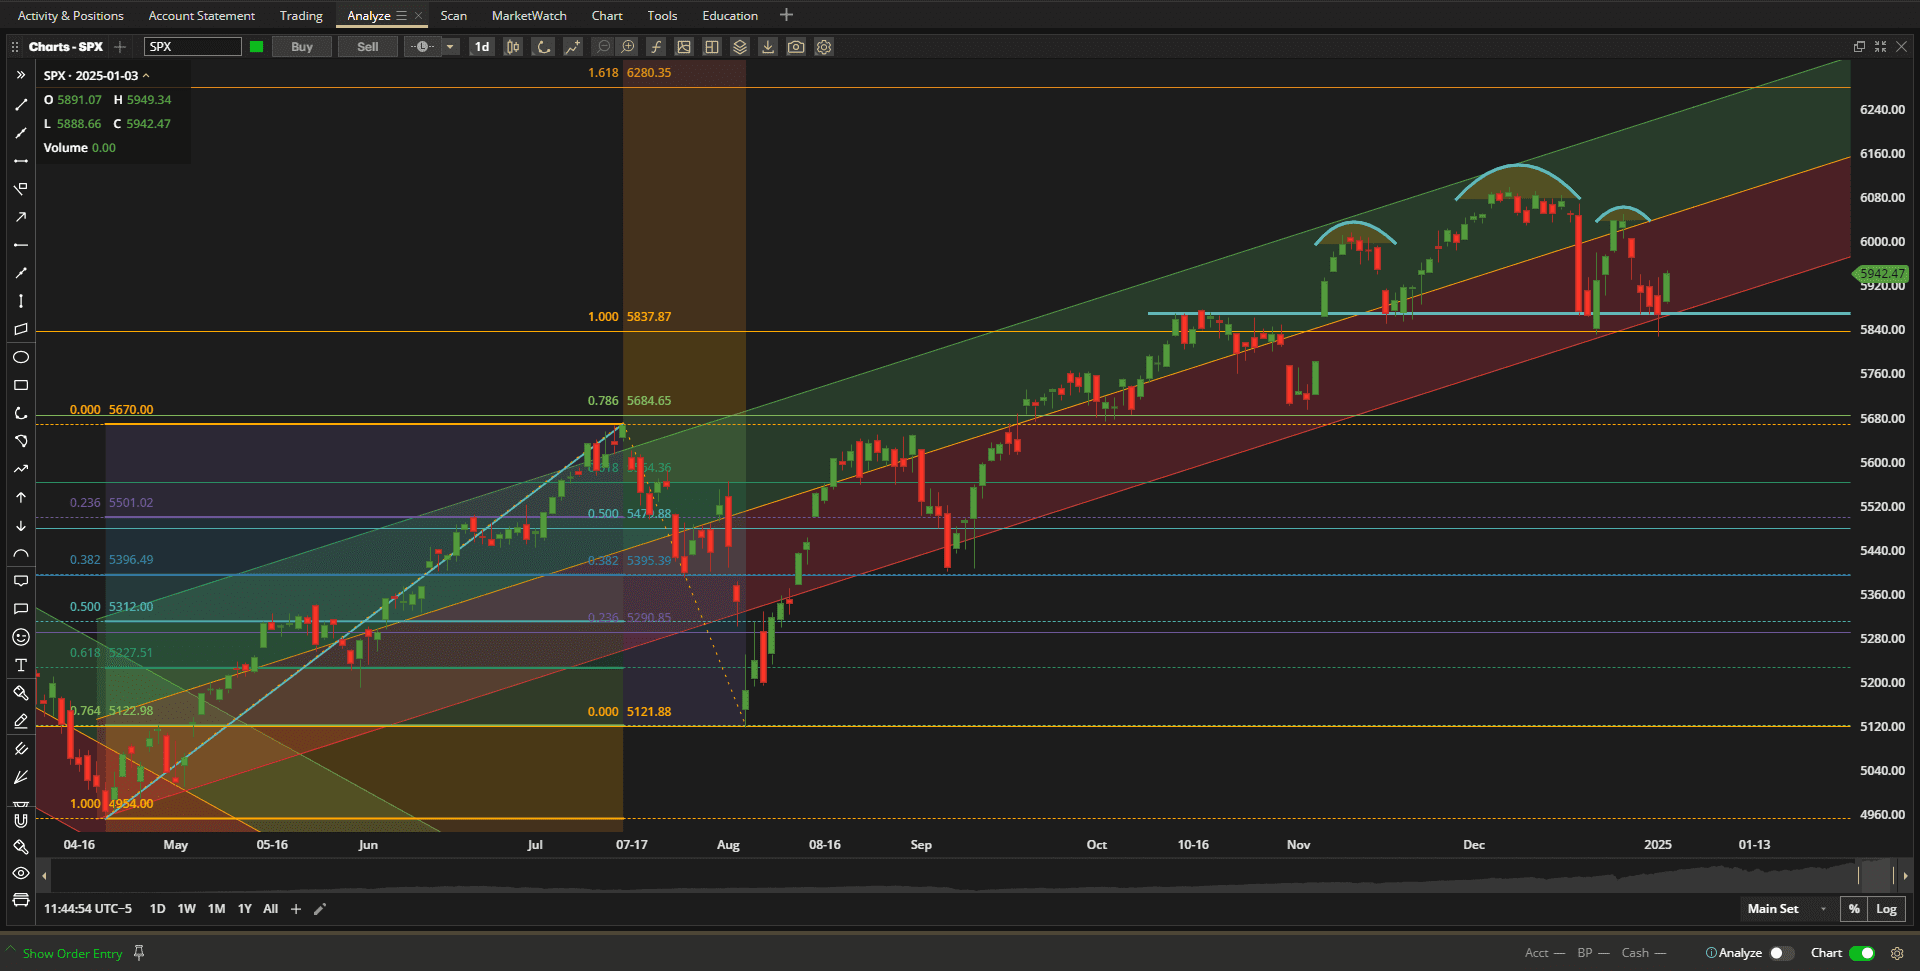 Prices are presently sitting at an important support/resistance level at ~5870. This is slightly above (but close enough for government work 🙂 ) the projected 100% Fibonacci extension level (at 5840) that I have shown on these charts for many weeks/months and forms the “neckline” (pale blue horizontal line) of a “head and shoulders” pattern that I mentioned last week. We are still in the uptrend channel that started in 2024 April and that has led to a 20% gain from that time. If this level holds as support we could still see movement towards the 6240 level where we might find the next level of resistance after taking out the all-time highs yet again. However, if the “neckline” doesn’t hold and we drop out of the channel and close below 5840 then technical analysts that follow patterns like the “head and shoulders” pattern would look for the next level of support to be at ~5680 or the same distance below the “neckline” as the “head” was above it. This is also an area of strong support/resistance from previous pivots in July, September, October and November.
In terms of relative strength, US equities dropped close to the bottom of the list:
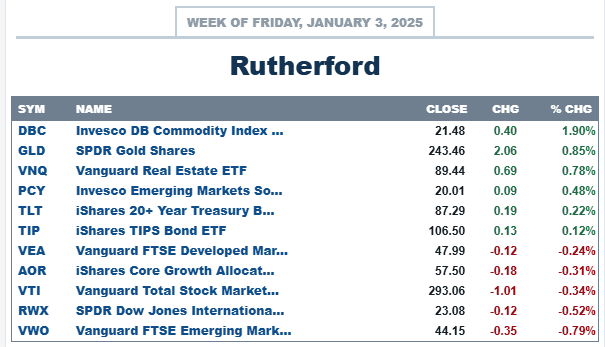 with Commodities and Gold leading the way.
For the sake of completeness, and before re-organizing the composition and management of the Rutherford Portfolio for 2025, the performance of the portfolio over the period since adopting the momentum rotation model looks like this:
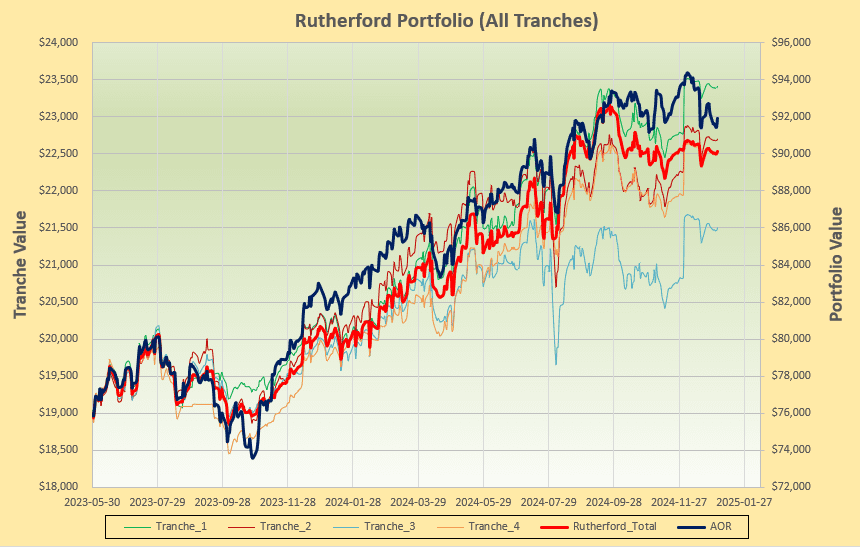
I have adjusted the total portfolio curve (solid red line) to correct for my error in missing an adjustment after selling shares in August of last year that erroneously showed significantly poorer performance compared with the benchmark AOR Fund. Performance is still below the benchmark but much of this is due to the fact that I have been winding down the portfolio over the past couple of months – otherwise it has tracked the benchmark reasonably well – but maybe not worth all the effort.
The Portfolio held ~$90,000 before I needed to make mandatory withdrawls (since it sits in a retirement account) so I plan to reduce the size of the portfolio, going forward, to ~$70,000.
Now for my planned changes.
I plan to keep the concept of a diversified portfolio so I plan to use ~$10,000 to manage a portion (Part 1) of the portfolio that will hold all assets in the new Portfolio “quiver” with allocations based on the Risk Parity concepts presently used to manage the Darwin account. In fact, I will discontinue the Darwin Portfolio but will add additional/alternative assets whilst maintaining the same methodology for risk control – target volatility and risk parity weighting.
First of all, my new Portfolio quiver will look like this:
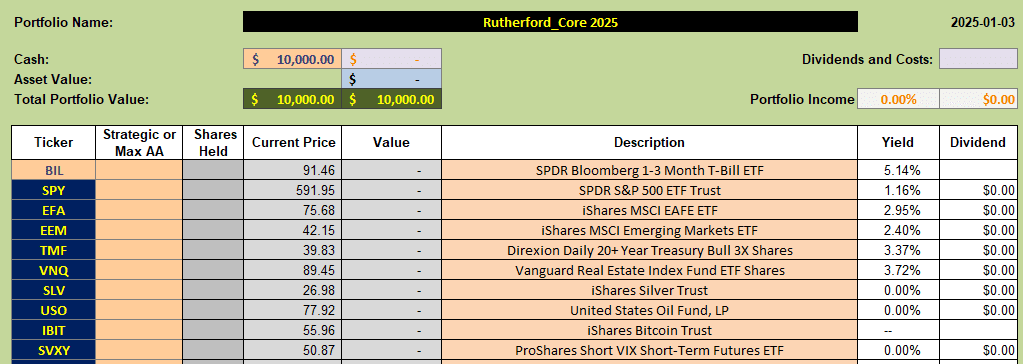
At the top of the list are US and International Equity ETFs (SPY, EFA and EEM) as in my previous portfolio – except that I have chosen different tickers, primarily for liquidity reasons, that I will explain when we get to Part 2 of the portfolio.
I really don’t like bonds 🙂 – primarily because risk parity determines a high allocation of funds to these assets – usually with low returns. But, it’s all related to risk, so I’ve changed from the 20Yr Unleveraged TLT ETF to the 3X leveraged TMF Fund. In this way I can include bonds with a smaller (leveraged) investment – recognizing the increased risk but with a volatility target limit.
I will keep VNQ as an investment in the Real Estate sector but will drop International Real Estate as a separate asset class.
Rather than Gold (GLD) I will shift to Silver (SLV) for my metals asset class – primarily for the additional diversity offered from the industrial uses of silver rather than simply a “safe haven” for investment.
For my choice in the Commodity space I will narrow my scope by going with Oil (USO) since this is the primary mover in this segment of the market.
And, I can’t ignore the fact that Crypto is a different asset class that may become more significant as we go forward – so I am going with the Bitcoin ETF IBIT.
Lastly, I will include the inverse Volatility ETF SVXY in the portfolio – again for asset class diversification While I like to hold this ETF 80+% of the time I do not really want to hold it in a market collapse where volatility will increase (so SVXY will decrease in value) as everything else goes down. Although there may be compensation in this from the target volatility/risk parity calculations I may also have to use a little discrtion with this one from time to time.
So – a “quiver” of 9 diversified ETFs from which to allocate ~$10,000. Because this is a small portfolio, and trading costs can be high, I don’t “plan” on adjusting more often than quarterly unless allocations get really out of balance. We’ll see how it goes.
Here’s what the correlation matrix looks like:

i.e. correlations between +0.9 and -0.9.
and Based on current calculations, opening allocations look like this:

where I have set the volatility target at 2% per asset – 18% maximum total volatility but likely less than 10% due to diversification/correlations. This leads to ~90% of the $10,000 being invested. We’ll see what the prices look like when the market opens on Monday and I will update the post with the actual fill data.
In Part 2 of the new Rutherford Portfolio I plan to invest another ~$10,000 in Options on the same ETFs. I’m not sure that I will quite be able to keep costs below $10,000 – the price of Options in SPY is a little high (with SPY trading ~$600) and I can’t find a liquid equivalent in the “under $100” price range. We’ll see how it goes when once we get started. More details to come in Part 2 but I will be trading these Options to the upside (with Calls) and to the downside (with Puts) – but I’ll try to keep it simple so as not to put anyone off too much.
That would leave me with ~$50,000 in Cash that I would likely put in T-Bills (BIL) right now.
Thus, this is quite conservative in that my maximum risk – if everything were to collapse – should be less than $20,000 of a $70,000 portfolio (<30%) – but if I’m holding Put Options that isn’t anywhere near likely.
More explanations of the Part 2 strategy to come once I have Part 1 in motion. In the meantime please use the comments section to add questions for clarifications.
Update: 6 January 2025:
Today I bought shares in all nine ETFs identified above. The fills look like this:
 i.e. I spent $8,757.40 plus $9.00 commissions to populate the portfolio.
Going forward I will refer to this portion of the portfolio as the Darwin portion of the Rutherford Portfolio to identify the population methodology and management plan used to manage it. At the present time the Plan is to make no adjustments to this portion of the portfolio for at least 3 months – although I will be monitoring it and I may change that plan if I feel the need to.
At the close, the holdings look like this:
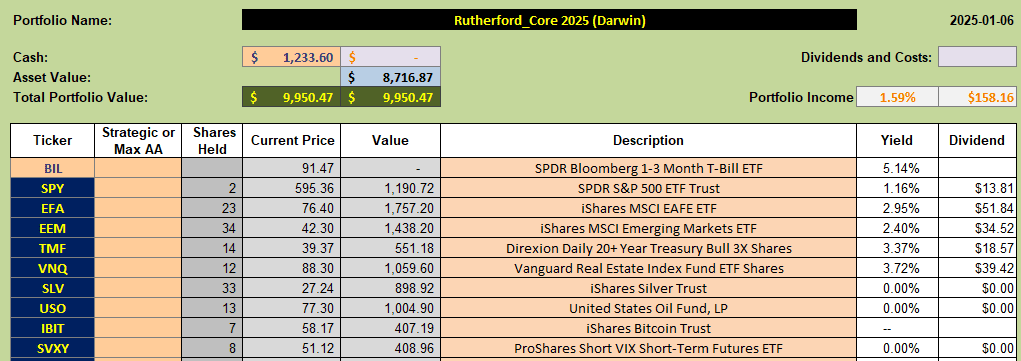 with ~$50 of slippage and losses – hence the large negative annualized IRR after the first day.
Because I didn’t really like being long EFA and TMF I also bought Put Options to include in the Part 2 portion of the Portfolio that I will try to post/explain tomorrow.
Discover more from ITA Wealth Management
Subscribe to get the latest posts sent to your email.
I have added an Update to the above post to document the population information for the portfolio.