
Street Musician
Point and Figure charts are unique to Technical Analysis.
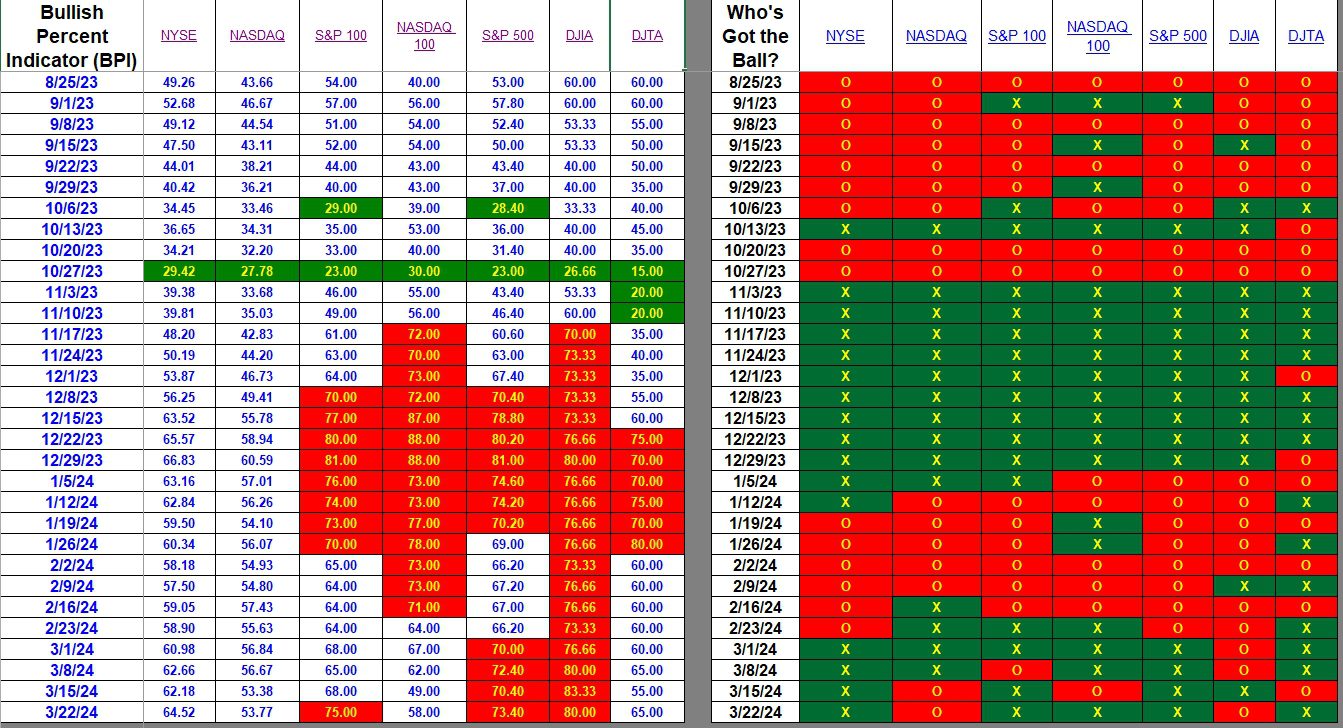
Bullish Percent Indicator (BPI) data for this week informs us this was a good week for U.S. Equities. Not every indicator moved up, but the vast majority showed an increase in the percentage of bullish stocks. The data found in the following tables comes from StockCharts and is then entered into an Excel™ spreadsheet as shown below.
Index BPI
The two major indexes, NYSE and NASDAQ, improved slightly this past week. Only the Dow Jones Industrial Average (DJIA) failed to move up. Both the S&P 100 and NASDAQ 100 jumped nicely. It could well be that the same stocks moved both indexes up.
Sector BPI
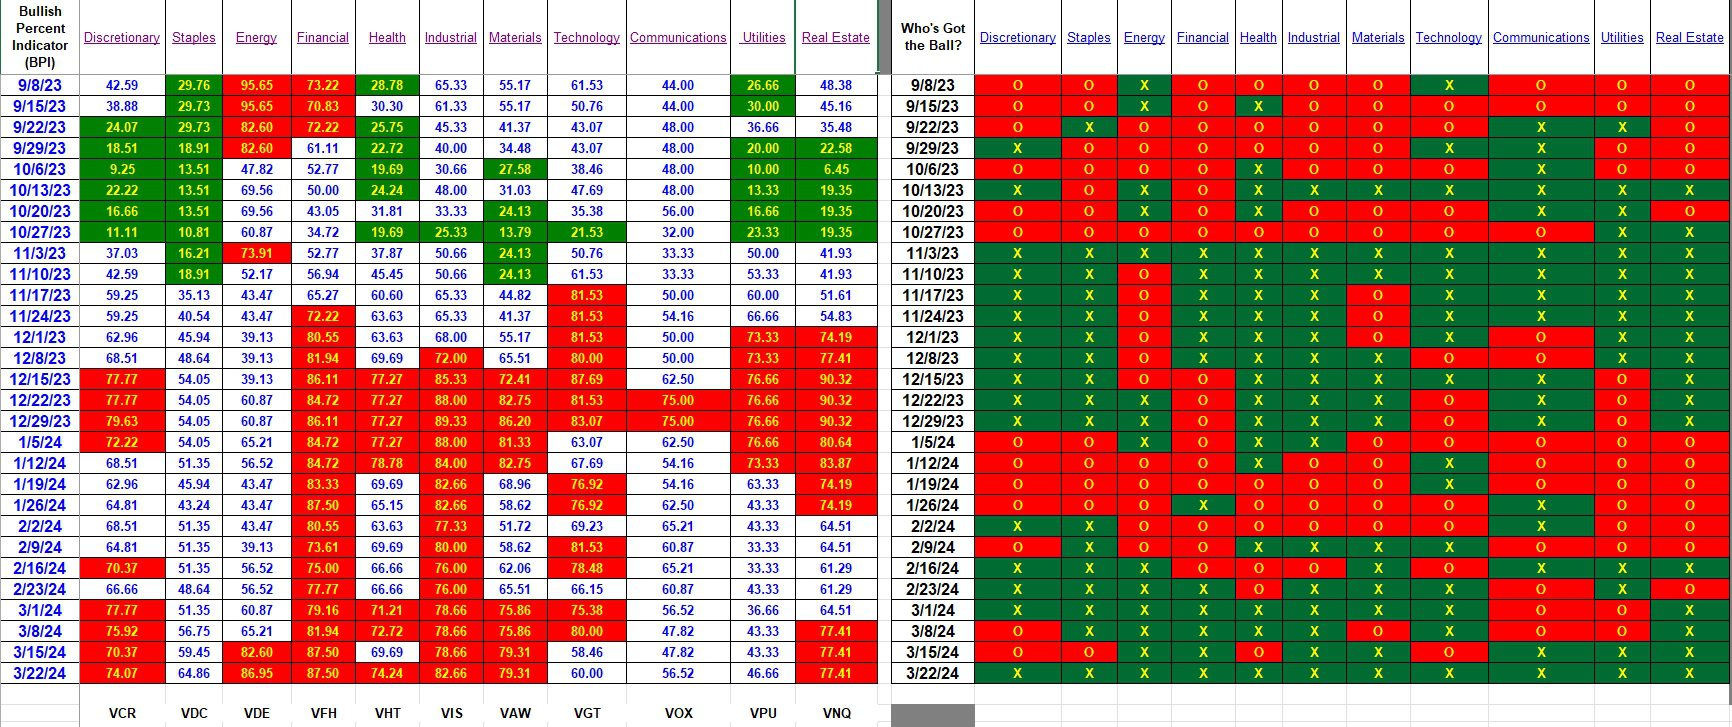
Every sector either moved up or held even. Since no sectors are in the oversold zone (30% or below) no purchases are recommended. The Sector BPI portfolios are currently holding Staples (VDC) and Utilities (VPU). Neither sector is overbought so we do nothing. Since Staples is close to overbought (70% or higher) I need to closely monitor this sector.
Explaining the Hypothesis of the Sector BPI Model
Discover more from ITA Wealth Management
Subscribe to get the latest posts sent to your email.
I checked the BPI data this morning (3/27/2024) and Staples dropped in the percentage of bullish stocks. The sector moved close to the overbought zone, but retreated so no sell signal is recommended. Utilities is still well into the neutral zone so no action there as well.
Lowell