
Astoria Pier 39
Millikan is one of the older portfolios using the Sector BPI investing model. Nevertheless, we are still in the hypothesis stage with this model as we need to traverse several Buy/Sell cycles to gain a better understanding as to how this model works in different market conditions.
New readers need to be patient and follow several months of updates in order to gain a better understand of the different portfolios tracked here at ITA Wealth Management. This blog is an educational site designed to help the small investor learn how to manage their own portfolios.
As an aside I see where Vanguard lowered their expense ratios for VTI and VOO down to one basis point. That is a rock bottom price.
Millikan Investment Quiver and Holdings
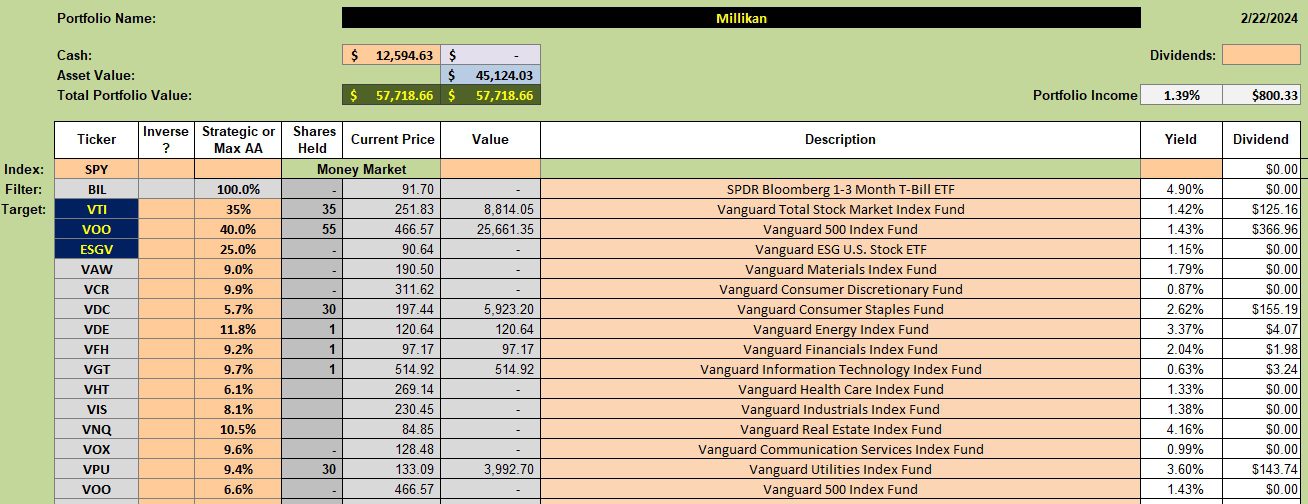
Below is the investment quiver and holdings for the Millikan. Utilities briefly dropped into the oversold zone last week and we picked up shares of VPU to meet this recommendation. The Millikan is still approximately 15 shares short of the 9.4% recommendation.
Millikan Manual Risk Adjustments
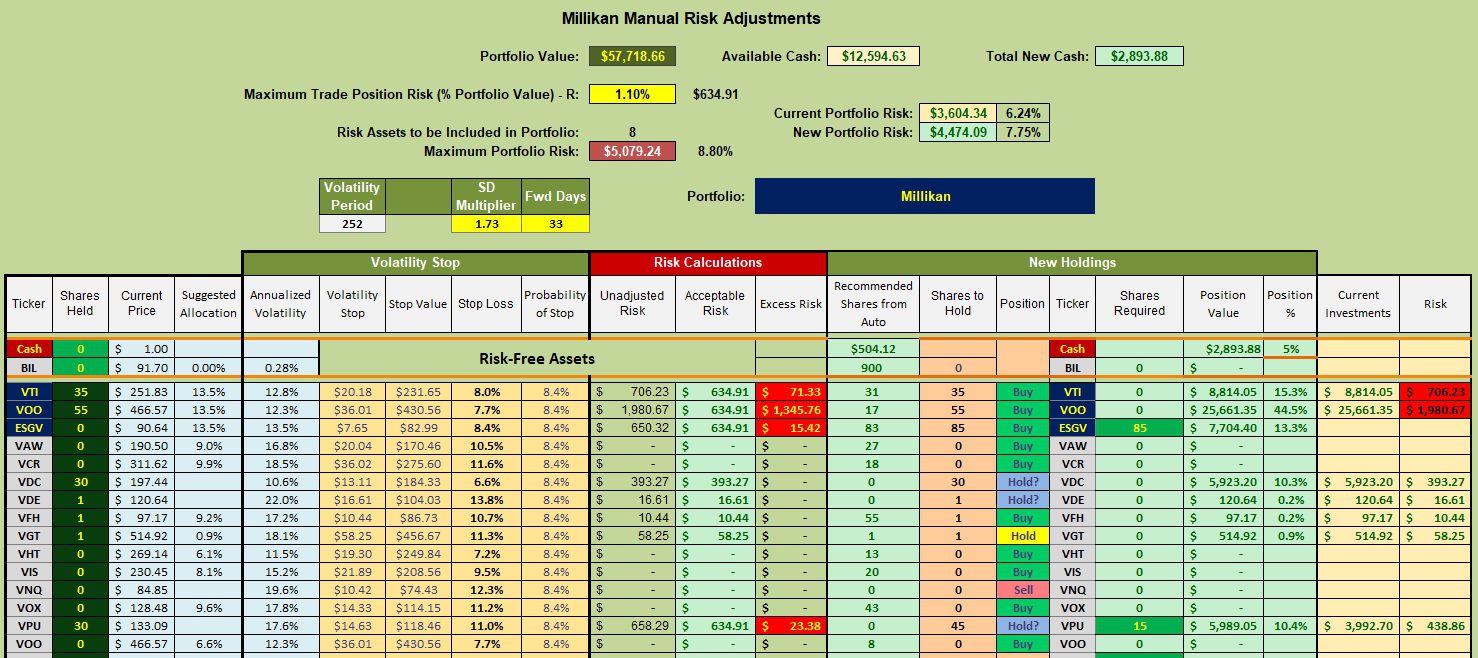
The following worksheet is part of the Kipling spreadsheet. This is where the investor begins to control how much risk to take with a given portfolio.
I adjusted the SD Multiplier to 1.73 so the Stop Loss for VTI is 8.0%. This move is standard procedure. Another critical adjustment is the Maximum Trade Position Risk which controls the Maximum Portfolio Risk. I generally strive for a 6.0% to 8.0% risk percentage. The 8.8% is a tad higher than I prefer, but still acceptable.
Limit orders are in place to add shares of VPU.
If one wished to simplify this portfolio one could eliminate ESGV as it has an expense ration of 9 basis points.
Millikan Performance Data
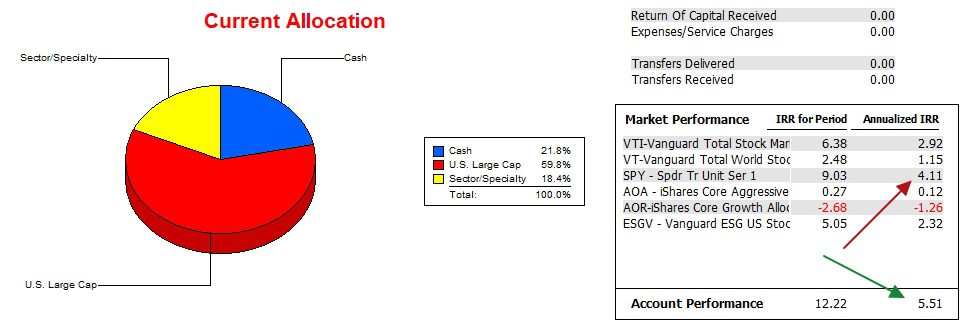
Over the past 25.6 months the Millikan managed to outperform SPY by a small percentage. SPY has been on a tear recently making it a difficult benchmark to outperform.
Millikan Risk Ratios
Based on the Information Ratio the Millikan continue to lose ground to the SPY benchmark. The same is true for the Jensen Alpha. While the slope of the Jensen is still positive, that will likely changes once February of 2023 clears the table next month.
Overall, the Millikan is performing quite well. It is currently carrying too much cash, but the owner may need to withdraw some money over the next few months. That is the reason for the high cash value.

Millikan Sector Performance Report
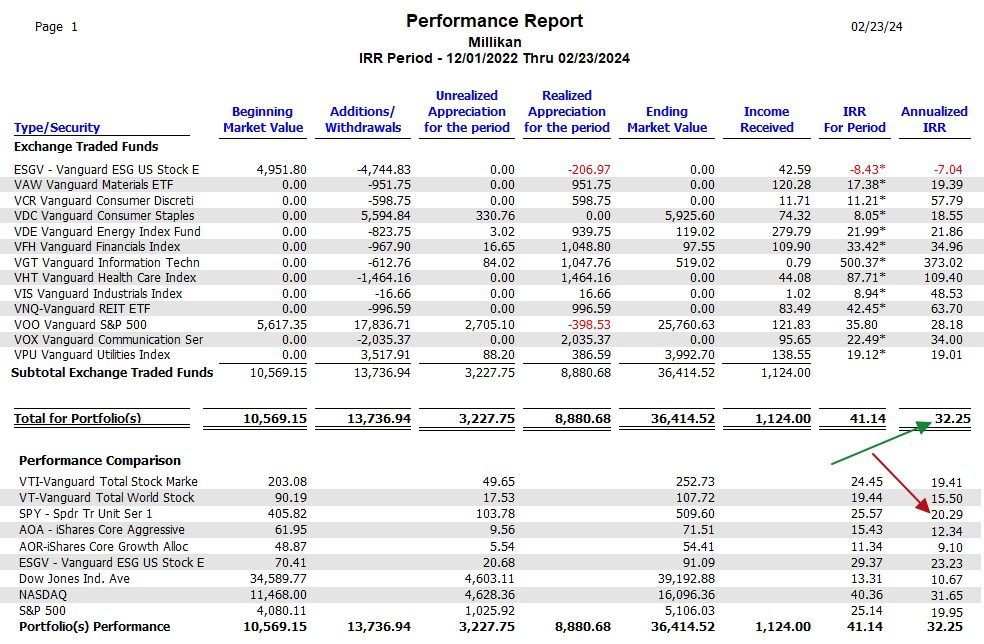
The following table is included in this review to show readers how well the sector ETFs performed since the Millikan began using the Sector BPI model back in December of 2022. We have a little over a year of experience and thus far are quite pleased with the results. Annualized, the Millikan holds a 10 percentage point lead on the S&P 500.
The percentages in the follow table differ from the performance table as cash in not included in the table below.
Pass this blog URL on to friends and family. Tell them to register as a Guest and wait to be elevated to the Platinum level. The ITA blog is free to all who register as a Guest.
Discover more from ITA Wealth Management
Subscribe to get the latest posts sent to your email.
You must be logged in to post a comment.