
1929 Arrow Airplane located at the WAAAM in Hood River, OR
Kepler, one of the Relative Strength or Relative Momentum portfolios is up for review this morning. Now that we are very close to the end of the third quarter, and this pertains to the close of any quarter, I’m reluctant to make any major changes. One reason is that I want to secure any possible dividends. Significant dividends will come from VNQ and SCHP. I explain what I plan to do with the nearly $20,000 in cash later in this blog post.
Kepler Investment Quiver
Below is the investment quiver for the Kepler portfolio. The ETFs selected for this account include the basic asset classes and market factors. QUAL and MTUM are market factors of quality and momentum. Many ETFs bridge both asset classes and market factors. VOE and VBR are examples where size and value fill both requirements of asset allocation and factors of the market. If readers are interested in market factors or better known as the Fama-French Five-Factor Model, one useful book is: “Your Complete Guide to Factor-Based Investing” by Andrew L. Berkin and Larry E. Swedroe.
Readers might notice that I set the Max AA higher for value and small-cap asset classes. For example, VOE at 25% is higher than VOT at 10%. VBR is higher than VBK. These are examples of tilting toward value and smaller size stocks.

Kepler Security Recommendations
Key decisions are made in the worksheet from the Kipling. 1) The Target Filter is turned on (green arrow). This trigger causes the software to look for securities that are performing above VTI. The logic goes like this. Since VTI is the total U.S. Equities market, and it is difficult to outperform the market, why not look for securities that are performing above VTI, not below VTI. That is the argument. 2) I set the maximum number of ETFs at 10 (blue arrow). Ten ETFs provide plenty of diversification for the owner of this portfolio. 3) The look-back period is one-year or 252 trading days. See the green arrow. Longer look-back periods reduce trading and I’m finding fewer trades tends to be beneficial, particularly in taxable accounts. 4) The investing model is LRPC. This makes a huge difference this month as the BHS model recommends zero Buys.
Notice how the Max AA percentages work. Ten Percent (10%) was my limit for VIS. You see that the software hit the 10% limit. There are eight other Buying opportunities and none had a limit of 10% so the remaining 90% is divided equally into those 8 ETFs.

Kepler Manual Risk Adjustments
If I were to follow the Kepler recommendations to the letter, I would do something similar to the column identified by the red arrow. Rather than selling off the five identified ETFs, I will override the recommendations. What I’ve done instead is to set many laddered limit orders to pick up shares of VOO at various percentages below the current price.
After the third quarter dividends are in, I’ll go back and check in on the Kepler and then make any necessary adjustments. An added comment on why I’m not in a hurry to sell off a holding such as VBK. While 10 shares is so small as to have little overall impact on the portfolio, when the market bounces off the bottom, Small-Cap Stocks tend to perform very well. VBK is that asset class and that is one motivation for not selling this particular ETF.

Kepler Performance Data
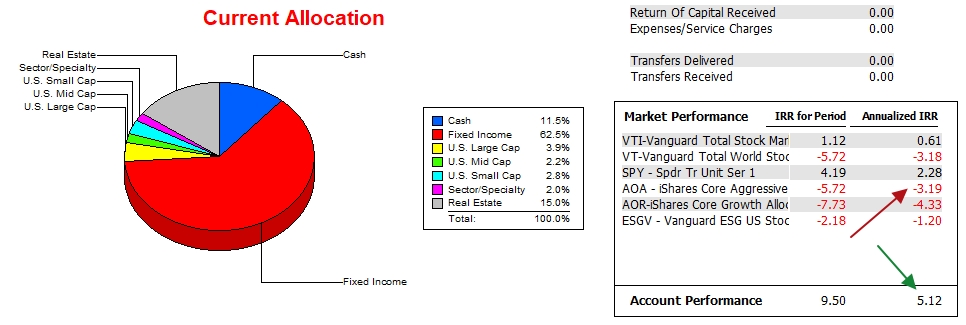
The strong IRR for Period (9.5%) since 11/30/2020 is another reason for not making many changes in the portfolio. Within the Investment Account Manager software I track six potential benchmarks and none exceed the Kepler. For the Relative Momentum portfolios AOA is the primary benchmark as the stock/bond ratio comes close to the asset allocation breakdown for these style portfolios. As readers can see, the separation between the Kepler and AOA is significant.
Kepler Risk Ratios
Despite the strong IRR values for the Kepler, we see the hit this portfolio has taken in 2022 by the negative slope of the Jensen Alpha value. Back in 2021 the Jensen was so high it was not sustainable. The current 10.7 value is very high and even that value will be difficult to maintain.
When I report on Portfolio Performance, several of these metrics are worked into an equation to determine the overall risk of the portfolio. Kepler ranks high on a risk adjusted basis. The current beta is a very low 0.323. If the S&P 500 declines further, the Kepler will not decline at the same rate. Nor will it rise swiftly if and when the market moves up.
The Kepler is set to go into neglect mode until October, at which time I might make further adjustments.

2022 Guidelines for Relative Strength Portfolios
Asset Allocation and Market Factors
Discover more from ITA Wealth Management
Subscribe to get the latest posts sent to your email.
very useful explanation for this novice. I am looking for a good risk adjusted portfolio like this. will keep in mind. I see that I may be able to translate the US etfs to their australian analogues with my 401ks in oz. thank you. other archetypes might be more descriptive of the model functions
Ken,
To understand the principles of Asset Allocation, I highly recommend William J. Bernstein’s books. His third investment book, The Investor’s Manifesto is a wonderful starting point. Many of the ETFs used in the Kepler are based on Bernstein’s AA model. You should be able to find mirror or similar ETFs in Australia.
Lowell