
BNSF heading west to Portland.
Early this morning I checked the current Bullish Percent Indicators (BPI) and no sectors are in the oversold zone. Therefore, no purchases are scheduled for the Gauss portfolio.
For new subscribers, oversold is defined as a situation where 30% or fewer stocks within a sector are bullish. To learn more about BPI data, go to StockCharts and look up Point and Figure (PnF) graphs or charts. Here is a link to the SPY ETF. This is what a PnF graph looks like. PnF charting is a very different way of looking at the price movement of a security. The x-axis of a PnF graph is not a date be a price reversal of a certain percentage.
What StockCharts does for us as end users is to analyze all the stocks within a sector to see if they exhibit X’s or O’s in the right-hand column. If 30% or fewer stocks in a sector are bullish (X’s in right-hand column) the sector is considered to be oversold. When 70% or more stocks within a sector show X’s in the right-hand column the sector is deemed to be overbought. When an overbought condition exists we place a 3% Trailing Stop Loss Orders (TSLOs) under the sector ETF. This is how the Sector BPI portfolios are managed, and the Gauss is one such portfolio.
If the Sector BPI investing model seems strange to you, be patient and continue to follow the Sector BPI portfolio reviews. At least one such portfolio is updated each week. This morning it is the Gauss portfolio. Over time this investing method will see quite simple and straight forward as it is essentially a mechanical method requiring few decisions on the part of the investor.
Gauss Security Holdings
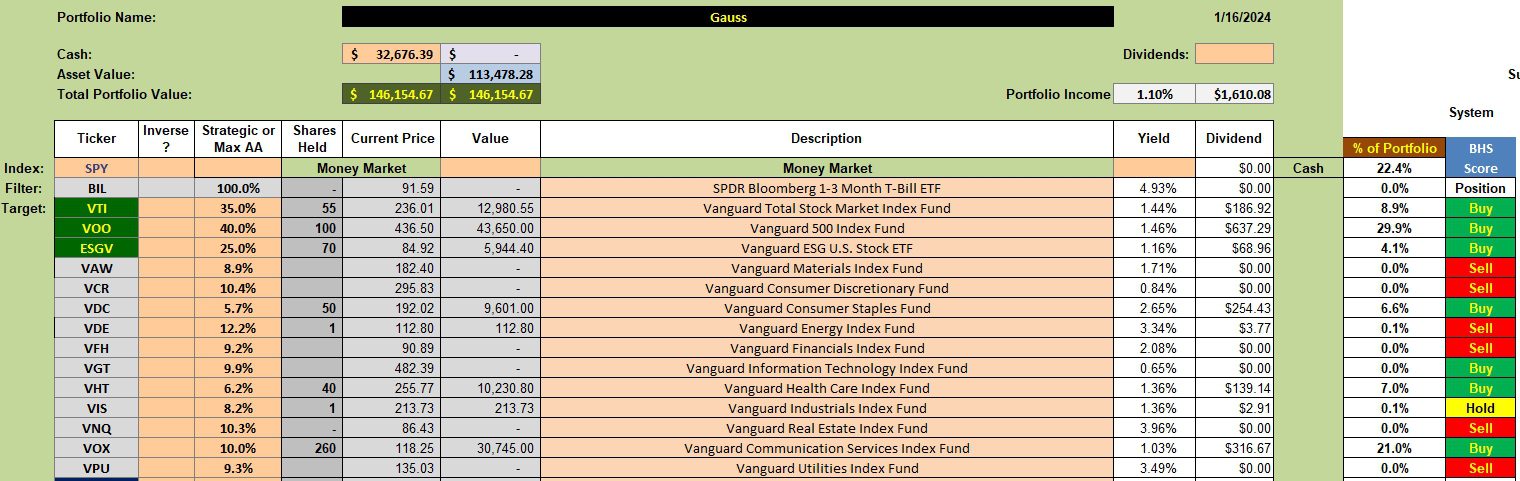
Below is the investment quiver and current holdings in the Gauss. Since the last review several sector ETFs were sold out of the Gauss as the January market is off to a very slow start. As sectors ETFs are sold the cash held in a money market rises. What I’ve been doing is dollar-cost-averaging into VTI, VOO, and ESGV. Over $32,000 remains in cash and I have numerous limit orders set at prices below the current price of each ETF. Just this morning shares were added to each of these three U.S. Equity securities.
Gauss Manual Risk Adjustment
The manual risk adjustment worksheet recommends adding another 50 shares of ESGV to the portfolio. Limit orders are in place to fulfill this recommendation.
Note that the SD Multiplier is set at 1.67 so the Stop Loss for VTI is 8.0%. This is one risk control I employ. The Maximum Portfolio Risk is a tad lower than I prefer. I generally want that value to hover around 6.0%. I’ll make further adjustments the next time the Gauss is updated.
Gauss Portfolio Performance
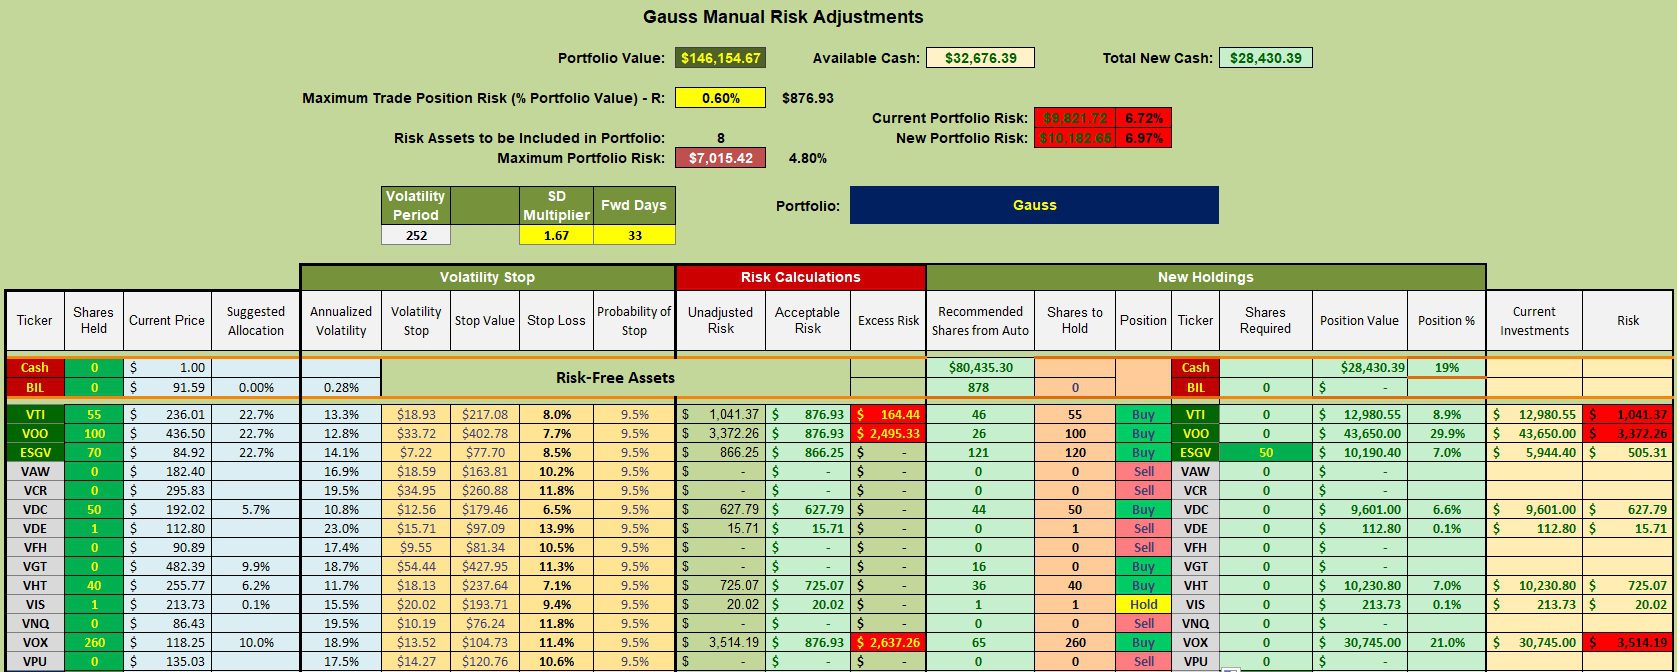
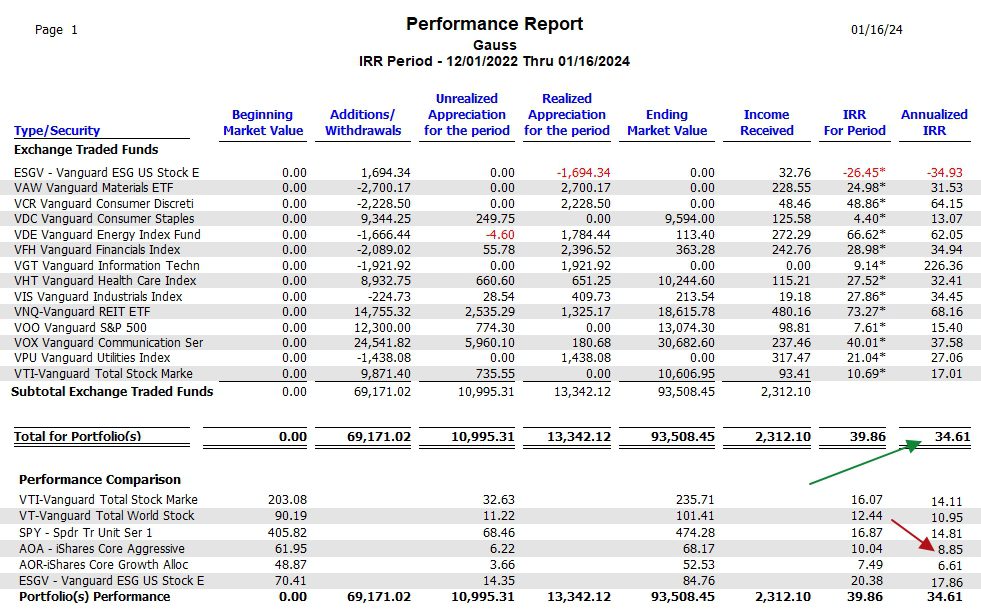
Over the past 24.5 months the Gauss managed to outperform the S&P 500 (SPY) by a small amount. The delta is even greater for the other five potential benchmarks. I consider it a success if a portfolio outperforms the SPY benchmark. Not all ITA portfolios are so fortunate.
Gauss Risk Ratios
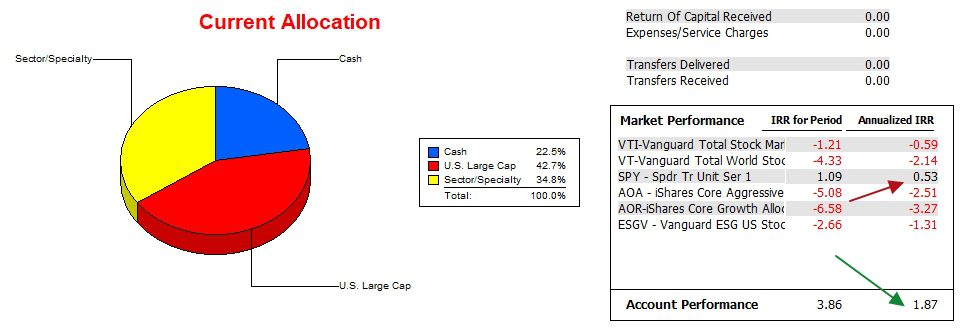
Despite rising short-term treasury interest rates the Gauss once more has a positive Jensen Performance Index value. The slope is also positive, due in part to low numbers back in January and February of 2023.
Note that the Information Ratio nearly has a perfect record of positive numbers. This ratio measure the head to head performance between the portfolio and SPY.
Gauss Sector BPI Plus Portfolio Report
For starters, the red arrow should point to SPY not AOA.
Checking the Beginning Market Value column, the Gauss did not hold any of the included ETF at the beginning of December 2022. The switch to the Sector BPI investing model was made shortly after December 1, 2022. The return of the various sector ETFs using Bullish Percent Indicator data and movement is outside the limits of uncertainty. Is one year an anomaly? That is the question to be answered month after month and portfolio after portfolio as we march through 2024. This being an election year, now is an excellent time to test the Sector BPI model.
PnF questions are most welcome.
Discover more from ITA Wealth Management
Subscribe to get the latest posts sent to your email.
HI Lowell
I use Stock Charts and understand the PnF charting stocks and ETFs. However the X & Os on the BPI charts are a result of a percent calculation. What I would also like to know is the total number of stocks in a particular sector. I have searched Stock Charts but so far, no luck.
Bob
Bob,
The following will not answer your questions as to the number of stocks StockCharts uses for their calculation, but checking the number of stocks in the Vanguard sector ETFs will give you a ballpark figure. Perhaps a Little League park.
VAW 116
VCR 309
VDC 104
VDE 115
VFH 394
VGT 312
VHT 421
VIS 392
VNQ 161
VOX 118
VPU 65
Lowell
Lowell,
Thanks that helps.