
“Old” Photo of Church
Innovation is the ability to see change as an opportunity – not a threat. – Anonymous
“In the realm of sector investing, Bullish Percent Indicators (BPI) serve as valuable analytical tools. These indicators help investors gauge the overall sentiment and strength of a particular sector within the market. By tracking BPI, investors can make informed decisions based on the collective bullishness or bearishness of a sector.”
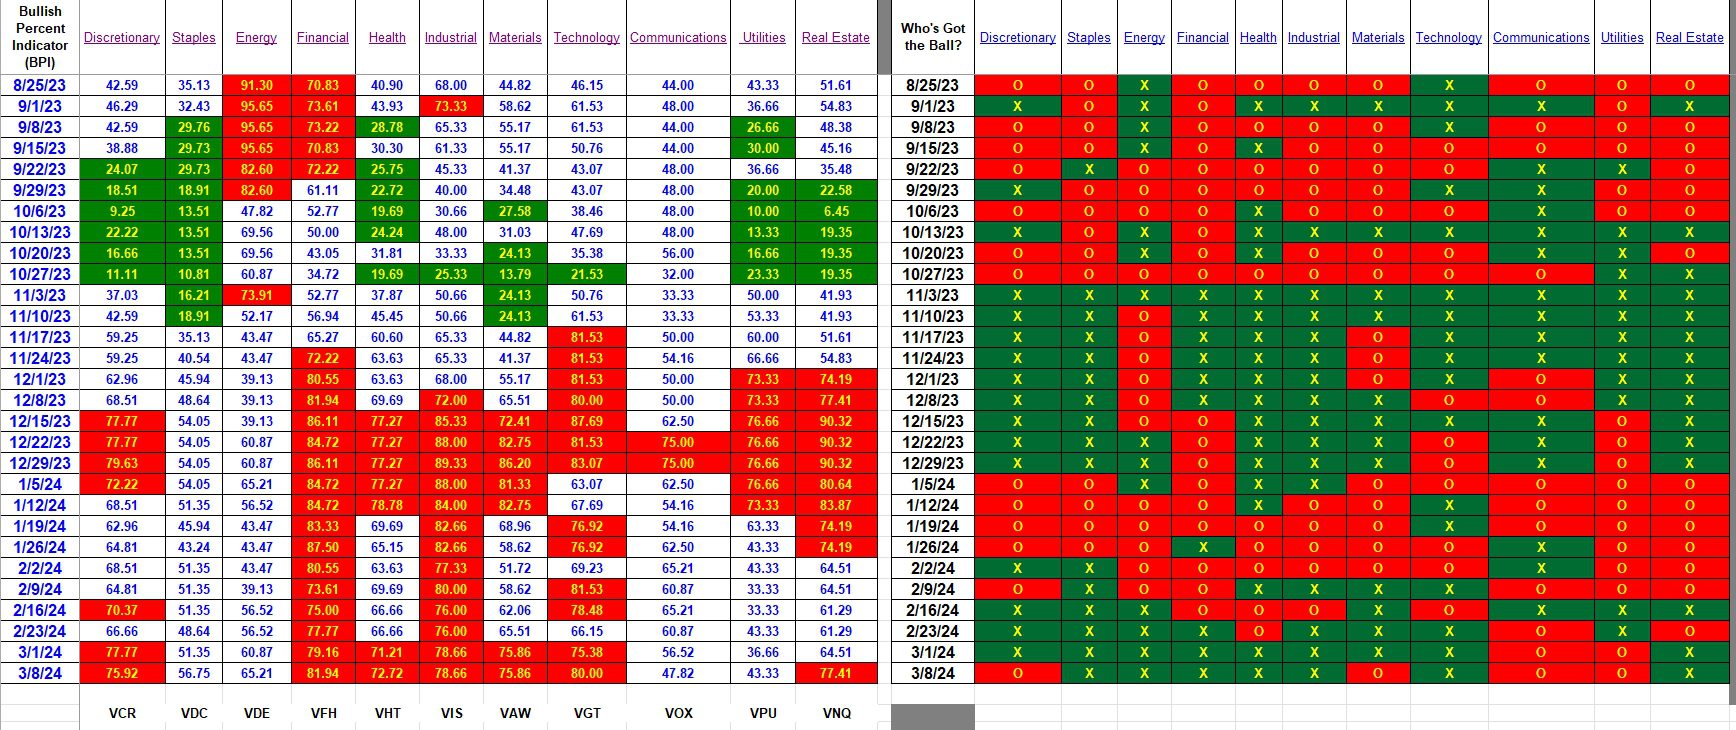
No sectors are in the oversold zone and all overbought sectors ETFs have been sold out of all the Sector BPI portfolios. Therefore, no action is required this week. However, we need to check to see what the broad indexes are telling us and are there any sectors approaching the oversold zone.
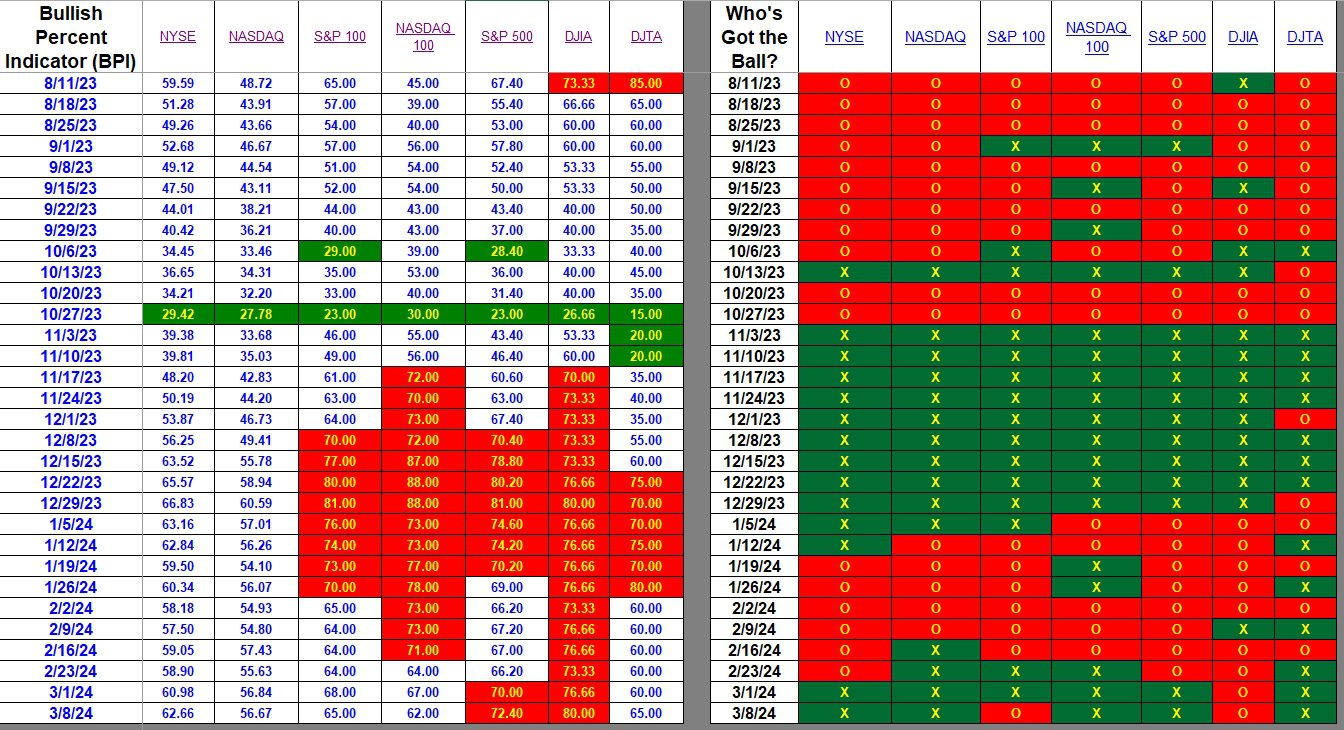
Index BPI
Based on Bullish Percent Indicators, this has been a mixed week for U.S. Equities. Both Dow averages improved when one checks the percentages on the left side of the following table. The NASDAQ dipped, likely due to a few tech stocks going bearish.
I pay most attention to the NYSE and NASDAQ and neither produced significant moves during the week.
Sector BPI
Sectors is where we go for specific information or Sector BPI portfolio guidance. Seven of the eleven sectors are overbought. However, the ITA Sector BPI portfolios currently hold VDC and VPU and neither of those sectors are oversold so we do nothing this week.
If you are holding cash and it is not needed, place limit orders to purchase shares of VOO and VTI. If capital preservation is required, place an 8% (or what risk is required) TSLO under the VOO and VTI holdings.
Explaining the Hypothesis of the Sector BPI Model
If you missed the latest Seeking Alpha article on Sector BPI investing, here is the link.
Discover more from ITA Wealth Management
Subscribe to get the latest posts sent to your email.
Hello Lowell Just for curiosity I looked up the four ETFs that were in a column of Os. I used the 3 box reversal-box size 1% used my Stockcharts. They had the four still in a column of Xs. Where did i screw up? Thanks. John
Good Morning, John,
I’ll attempt to clear up the confusion. The four columns with O’s are not individual ETFs. Instead they are broad sectors covering Discretionary, Materials, Communications, and Utilities.
Take Utilities as an example. In the BPI spreadsheet I look up the Utilities sector, not VPU. The sector takes in all stocks within that sector and I find a reading that varies from 0% to 100%. This percentage tells me what percent of all the stocks within the sector are bullish. Last Friday that reading was 43.33% for Utilities. Had the percentage dropped to 30% or lower I would then move to purchase shares of VPU.
VPU is Vanguard’s ETF that permits investors to invest in the Utilities index.
Conclusion: When looking up data on StockCharts there is a difference between a Utilities sector and the Utilities ETF, VPU. I understand how this might be a tad confusing.
Lowell