
If in Auckland (New Zealand) and you can’t tell White from Wong you can always eat here!
US Equity markets relaxed a little earlier this past week as the SPX (S&P 500 Index) pulled back to the bottom of the current uptrend channel and bounced off the 50-period EMA line:
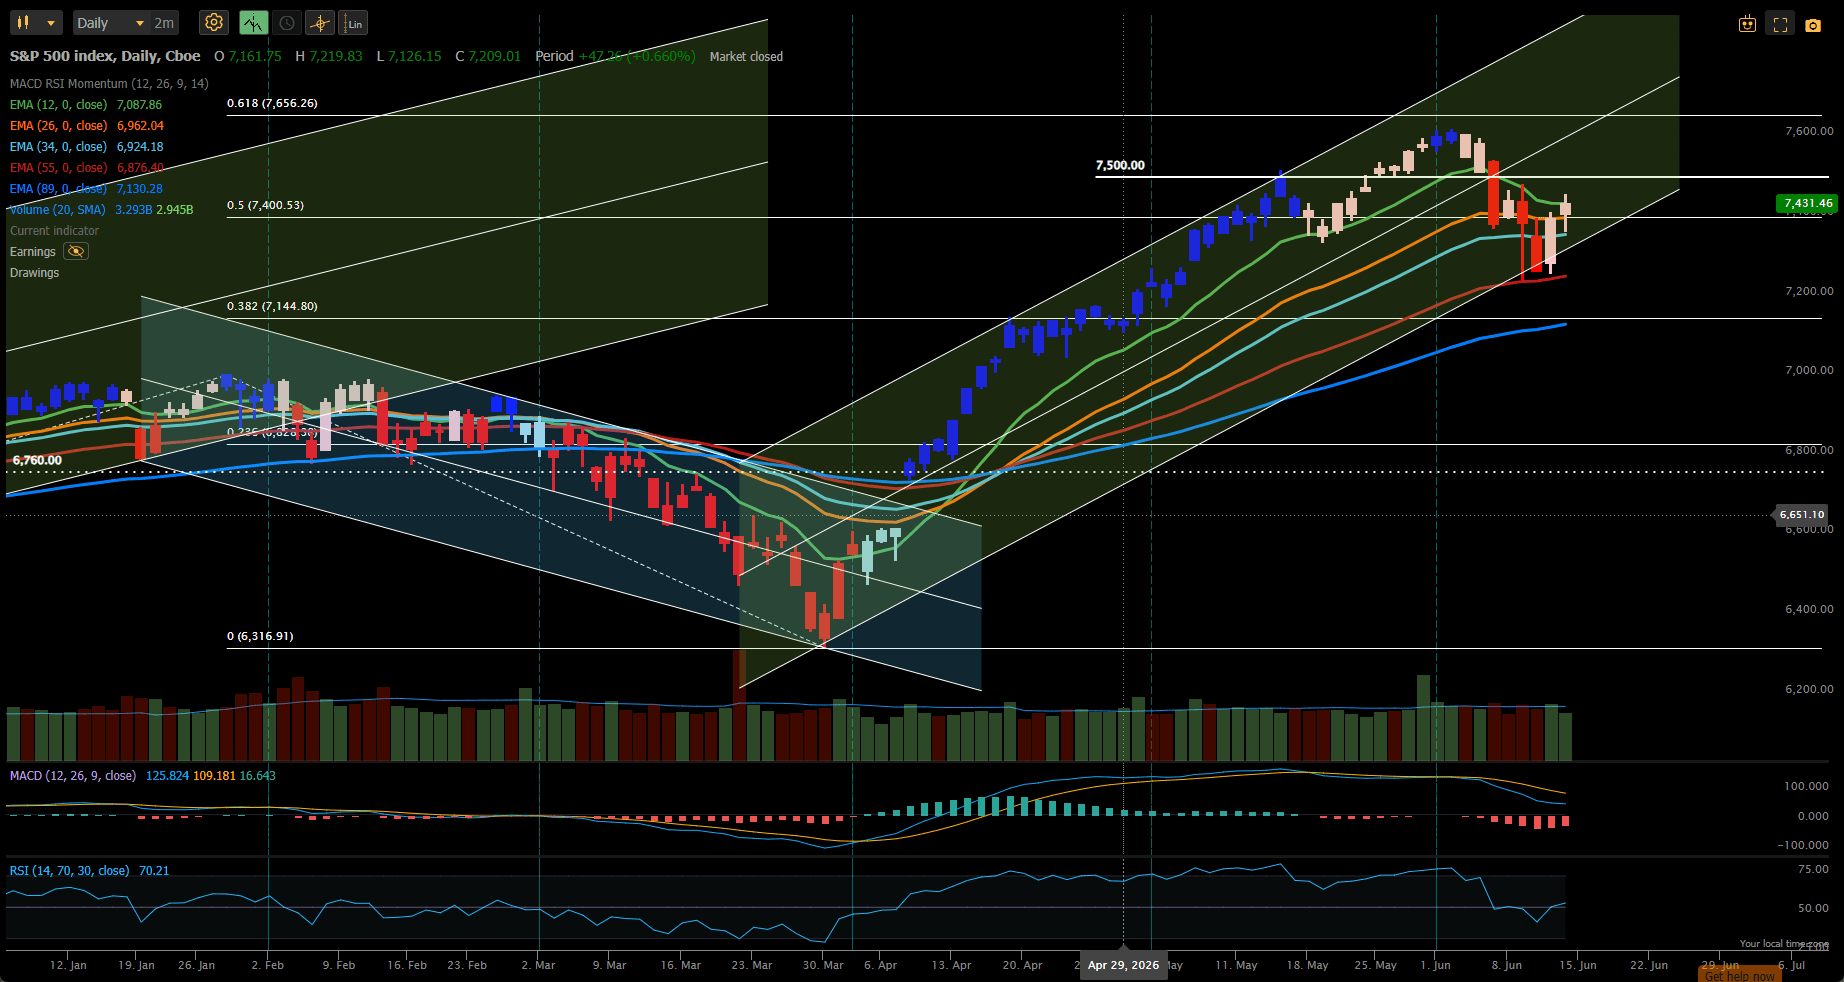
However, the SpaceX IPO hype brought some optimism into the markets at the end of the week and the index closed ~0.6% higher than last week’s close – but essentially still sitting on the prior support/resistance level at ~7400.
Compared to other major asset classes:
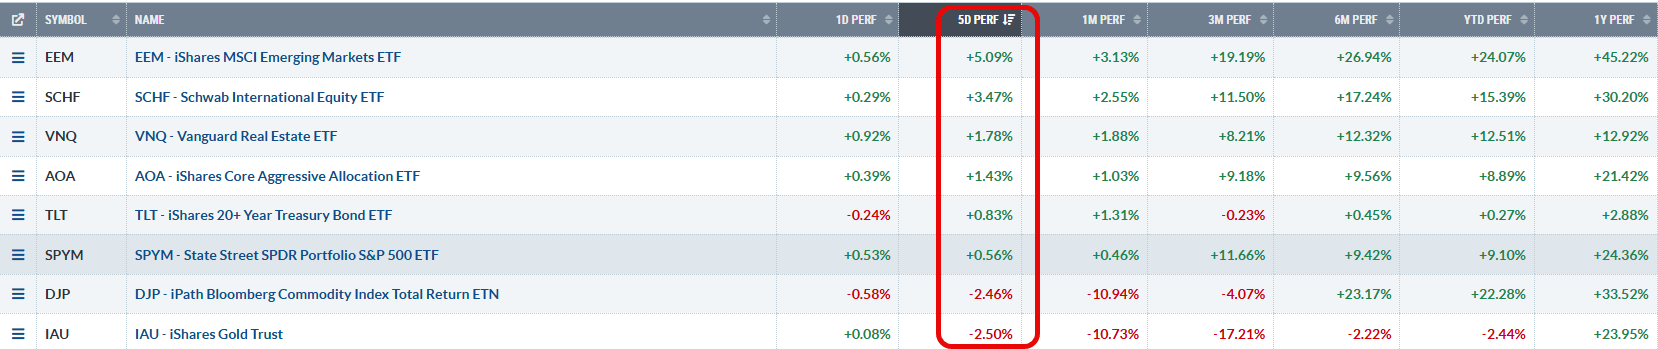 this placed US Equities towards the bottom of the list with International Equities (EEM and SCHF) significantly outperforming US markets. Gold and Commodities (Oil) were the big losers.
Although the Darwin Portfolio, managed with the help of my current momentum/mean reversion system, has performed well over the past six months – since adopting this system – my biggest problem has been with trying to maintain my goal of 100% fund allocation to ETFs held in the portfolio. At the present time I am only holding one ETF (EEM – Emerging Market Equities) in the portfolio and, although this ETF has been performing well, I am not comfortable allocating 100% of available funds to this one ETF. I would be more comfortable with more diversification (and, hopefully, less volatility) even if this means a potential drop in revenue. Of course, being only 25% invested means that I won’t see excessive volatility (or revenue) – but I am also not meeting my goal/objective of 100% allocation of funding. I am therefore working on a modified and (currently) simpler momentum system with more rigorous, well defined allocation rules. The momentum concepts are not changed significantly from the methods currently being used – but allocations, based on momentum rankings. are better defined. I have used Claude (AI) to help me build a new workbook since the existing workbook has been developed/modified over the past ~10+ years without the adoption of new features available in current versions of Excel. However, this new workbook is still at the development/testing stage before I decide to switch over completely. In the meantime I will try to introduce a few of the ideas into these weekly posts.
In the past week, adjustments to the portfolio look like this (red box):
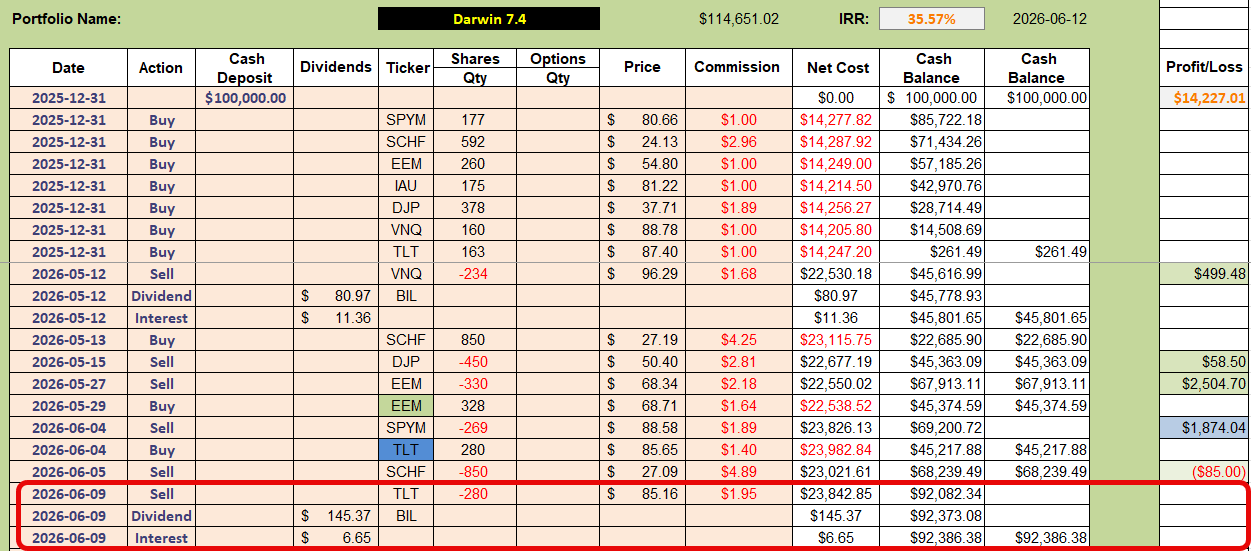 with the only action taken being to sell TLT (US Treasuries) out of the portfolio.
This is not totally in agreement with the analysis/recommendations from the current worksheet:
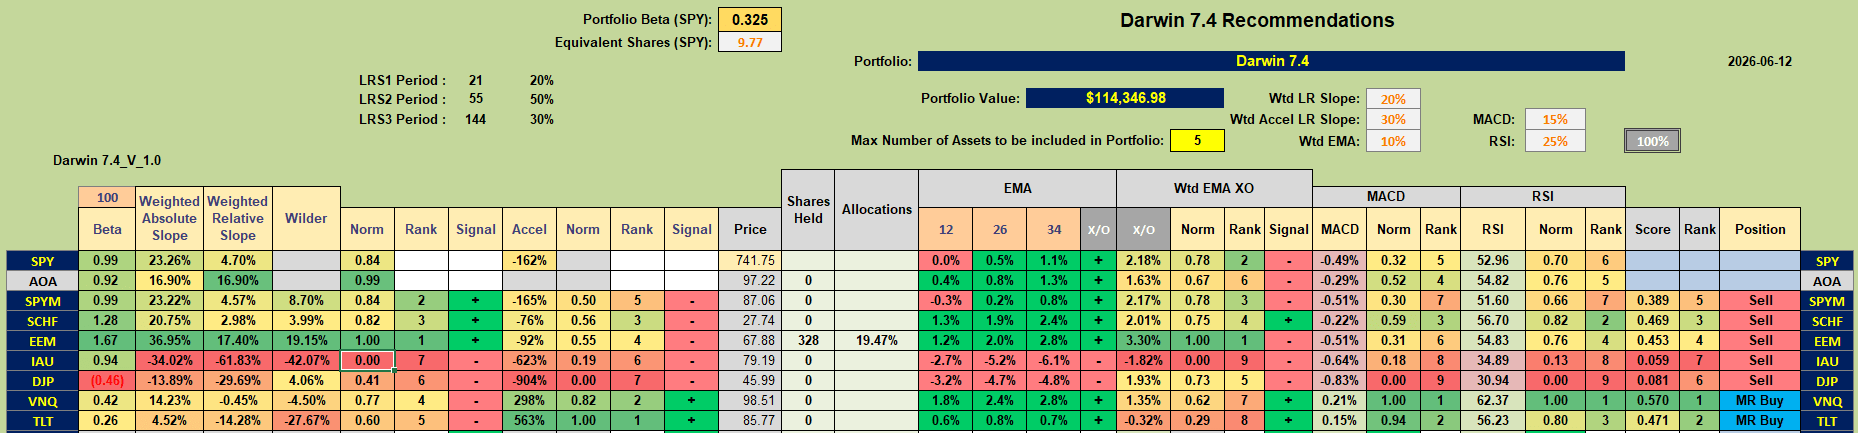 that is generating a Sell recommendation for EEM (that is currently held) and Mean Reversion (bottom fishing) Buy Recommendations for VNQ and TLT.
Let’s compare this with analysis from my new workbook:
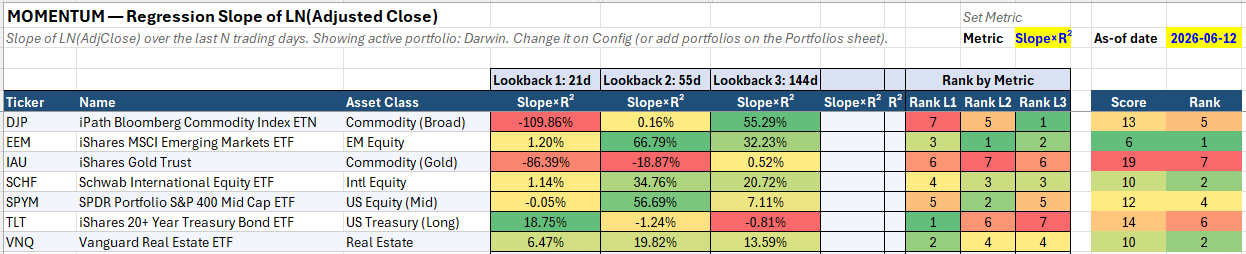 that is simply using a ranking of momentum over 3 lookback periods (21-, 55- and 144- trading days). Summing the rankings for each ETF and ranking the sums (last column on the right) generates a suggestion that EEM is the strongest (relative) performer, with SCHF (Developed Market Equities) and VNQ (US Real Estate) tied for second position. TLT ends up close to the bottom of the list, in sixth place.
Since I always believe that it is wise to check the charts before making decisions let’s take a look at some of these charts.
First of all, the current model has a Sell recommendation for EEM while this is the top ranked ETF in the new system – so, why the difference?
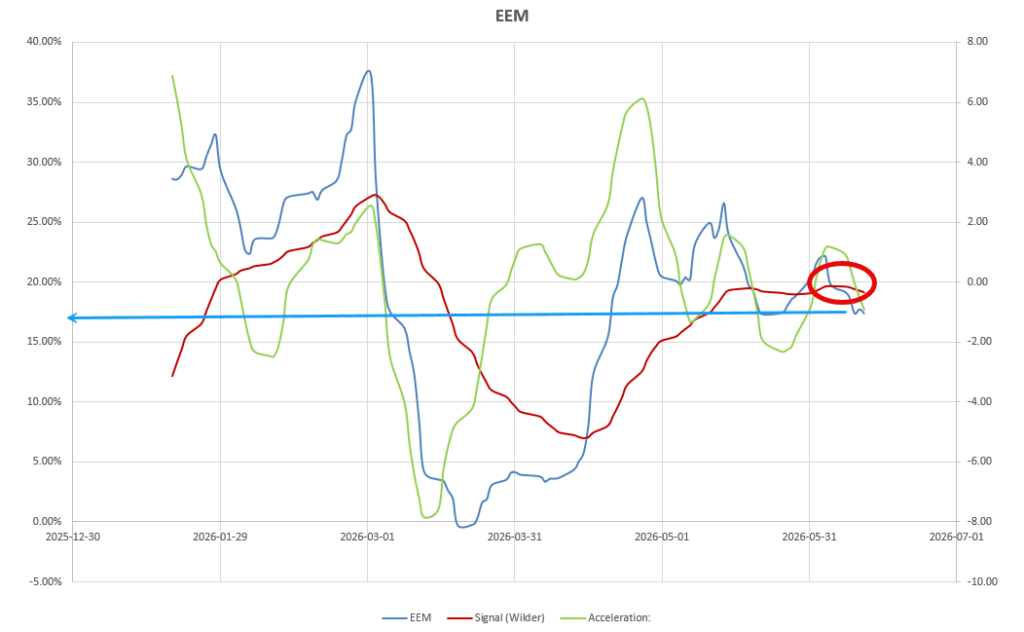 The above screenshot shows the momentum/acceleration graphs using the current system and, sure enough, acceleration (green line) has just turned negative and momentum (blue line) has recently crossed below it’s 14-period Wilder Moving Average (brown line) – thus generating a Sell signal. However, momentum (left axis) is still highly positive – and this is where the new system is (currently) focusing.
From the new workbook I can generate plots like this:
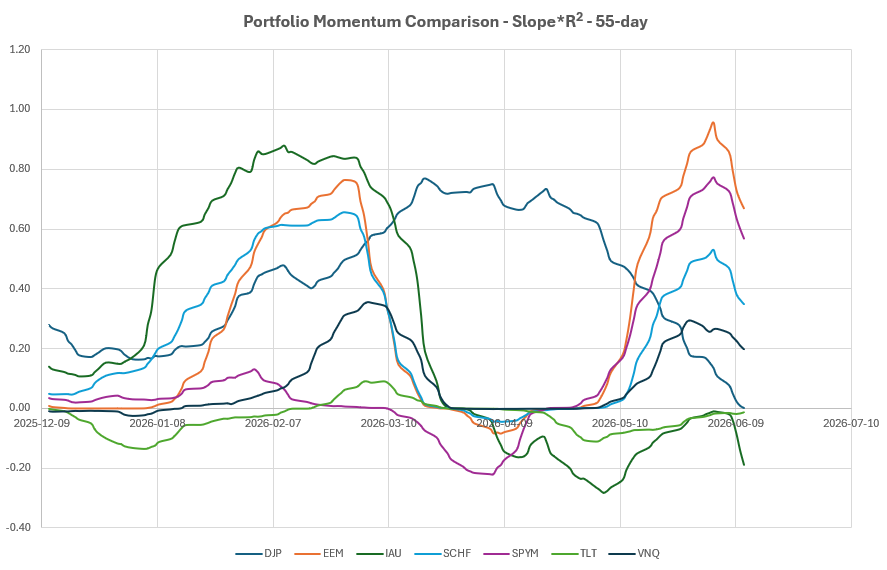 that show, graphically, the momentum strength of EEM (top yellow/gold/ochre line – probably depending on your monitor) relative to the other ETFs in the portfolio “quiver”. However, note that momentum is falling in just about all ETFs in the quiver – with the exception of TLT, that is favored as a recommended Buy using the current system. Recognize that this is only the 55-day look-back comparison – the 21- and 144- day pictures are different – as can be seen in the analysis table above – but this shows the relationships fairly clearly so is used as an example. The individual (look-back) rankings are used to weight the final ETF Rankings.
Finally I take a look at the price charts to see which recommendations make most sense:
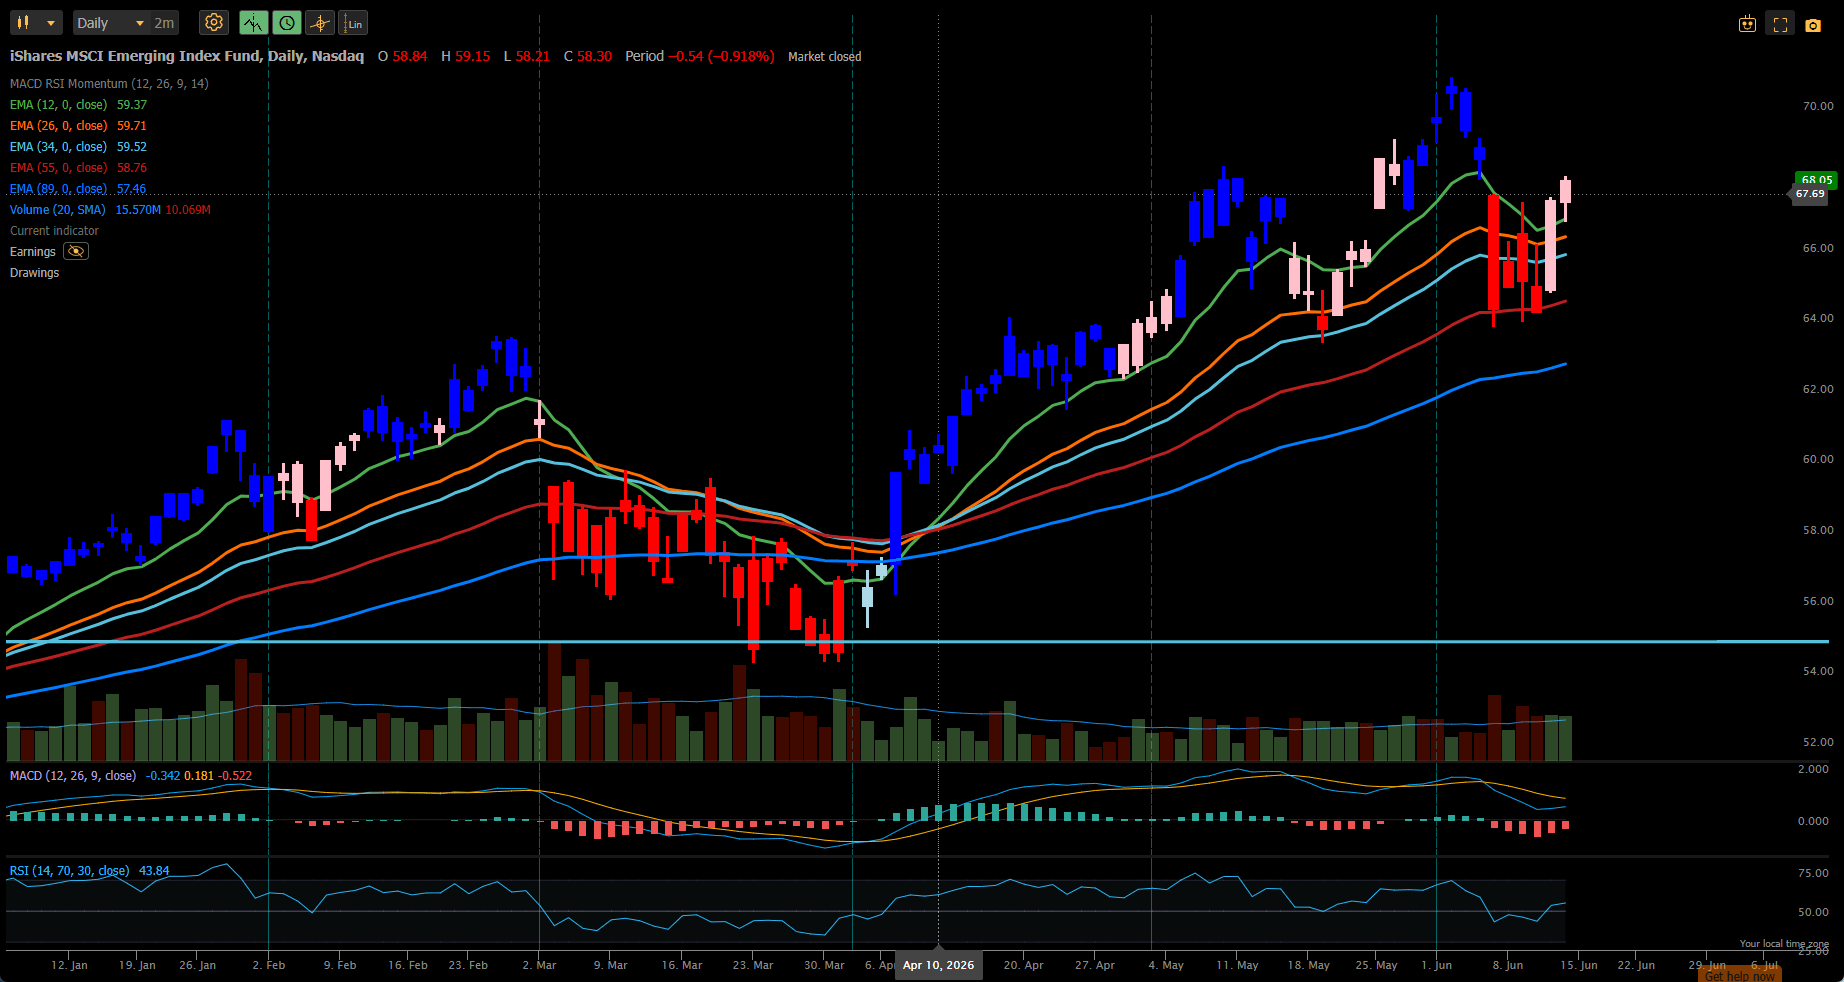 and I can see why the current model generated a Sell signal (on the pullback – red candles) but that things seem to be recovering with moving averages bullishly stacked and at least one short-term indicator (RSI) turning bullish. Hence my decision not to sell EEM just yet – and to favor the new system at this point.
However the new system does not (directly) consider other (shorter-term) indicators – so these might still be added back at some later date. At present I’m still trying to KISS it.
Let’s quickly look at some of the other options/choices – TLT, VNQ and SCHF:
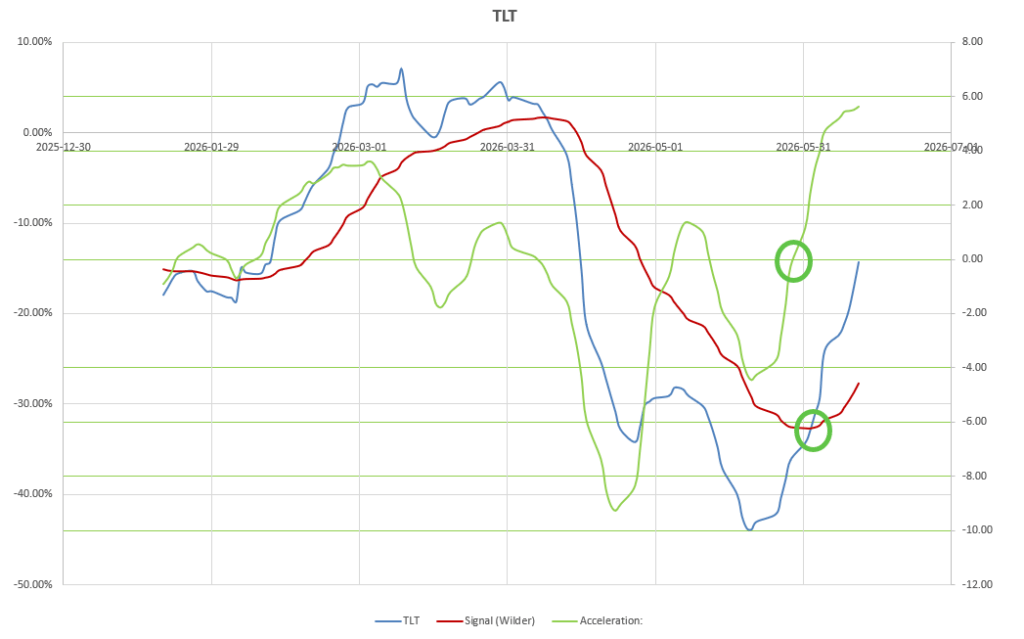 The current model is definitely supporting a Buy decision – but momentum is negative, so this is definitely a Mean reversion candidate. Looking at the price chart:
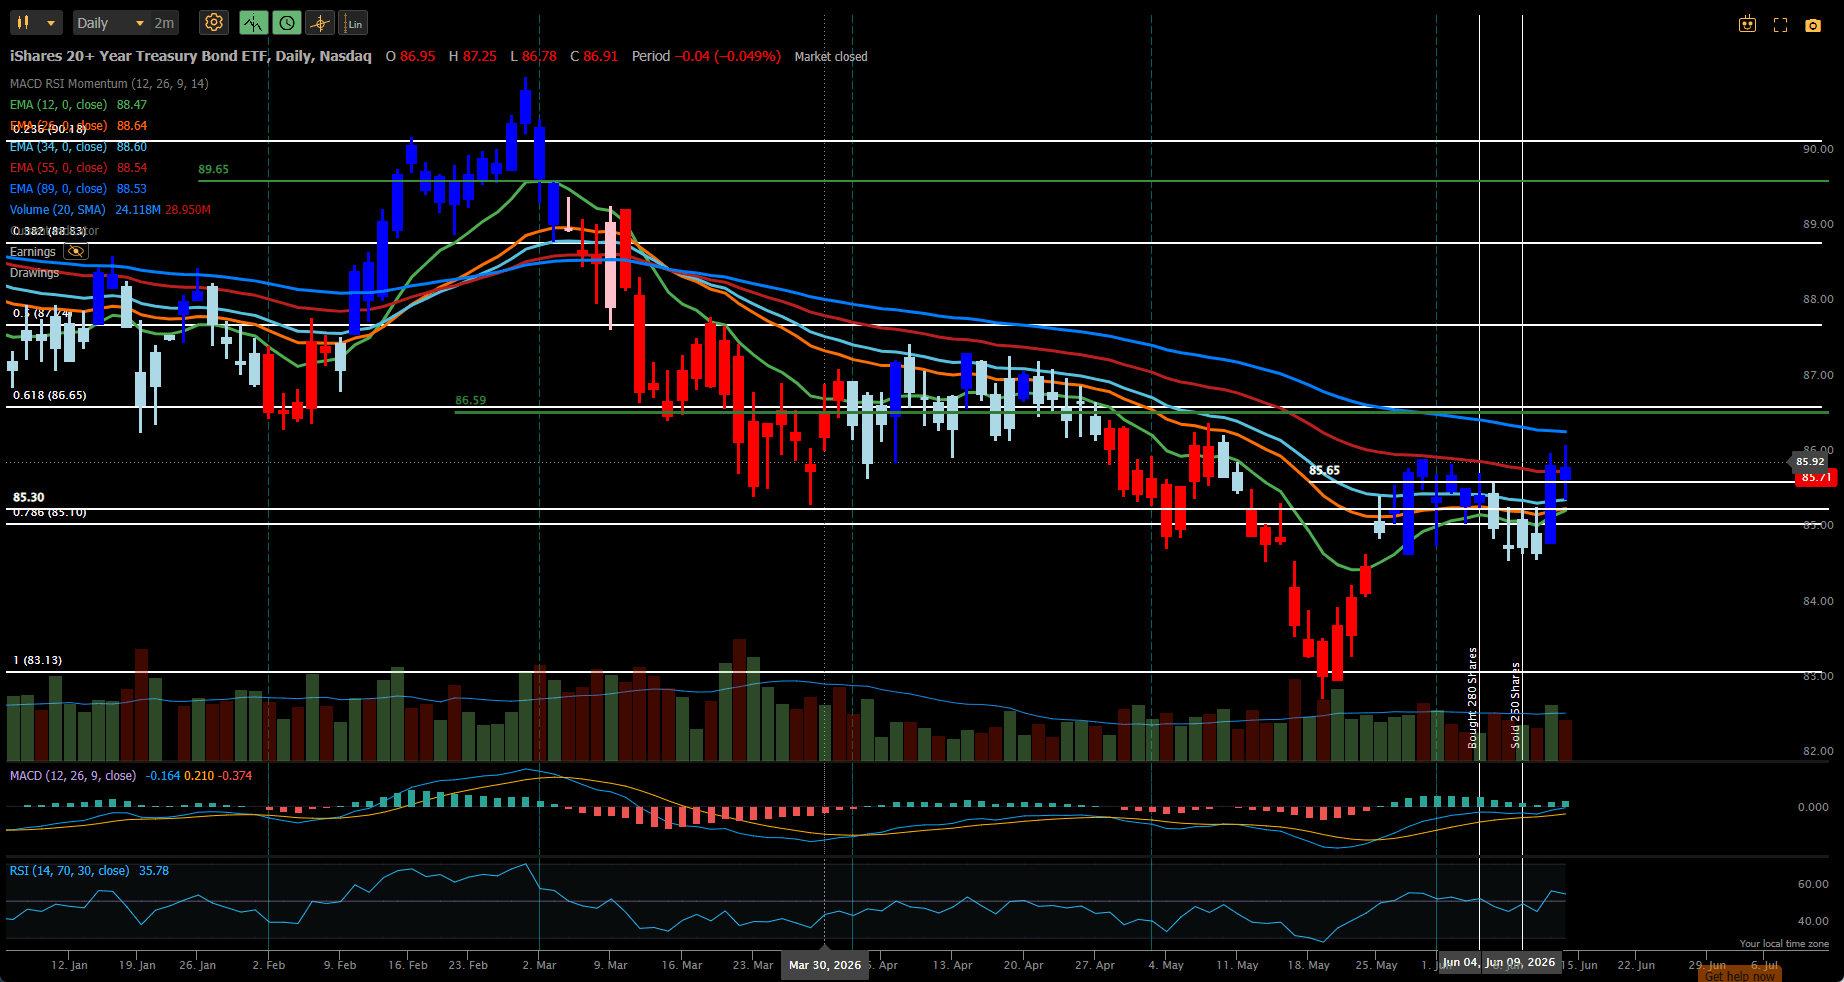 this is certainly looking like a “turn-around” candidate – so probably not a bad decision to hold in a portfolio – but the strength (momentum) in a move higher might not be too great – and there may be better candidates – so I am am holding off for now (although it does pay out a reasonable dividend).
VNQ is a recommended (Mean Reversion) Buy in the current system:
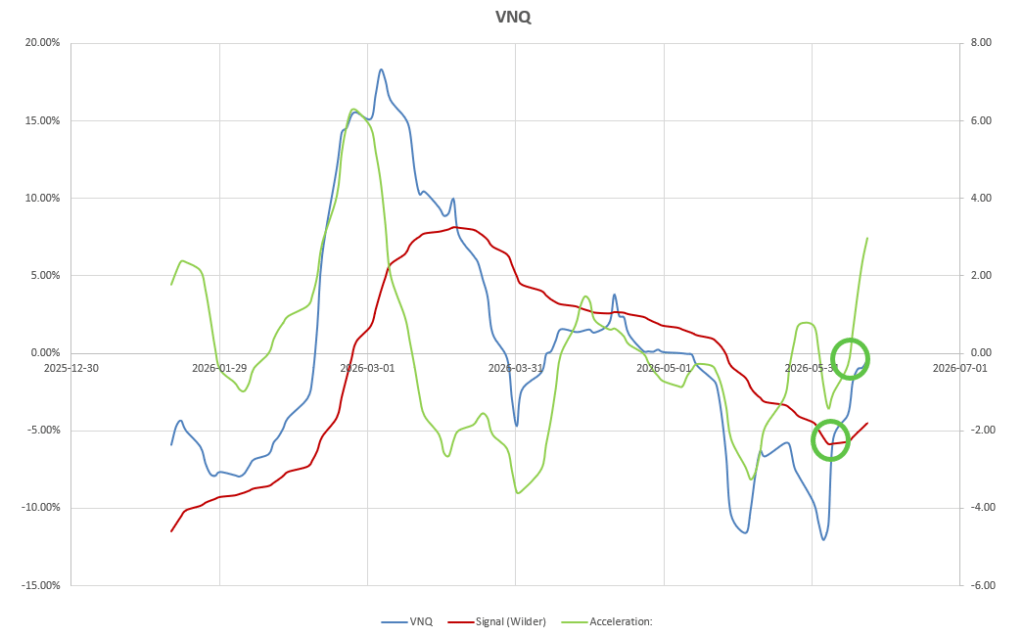
and has just arrived at #2 in the new system,
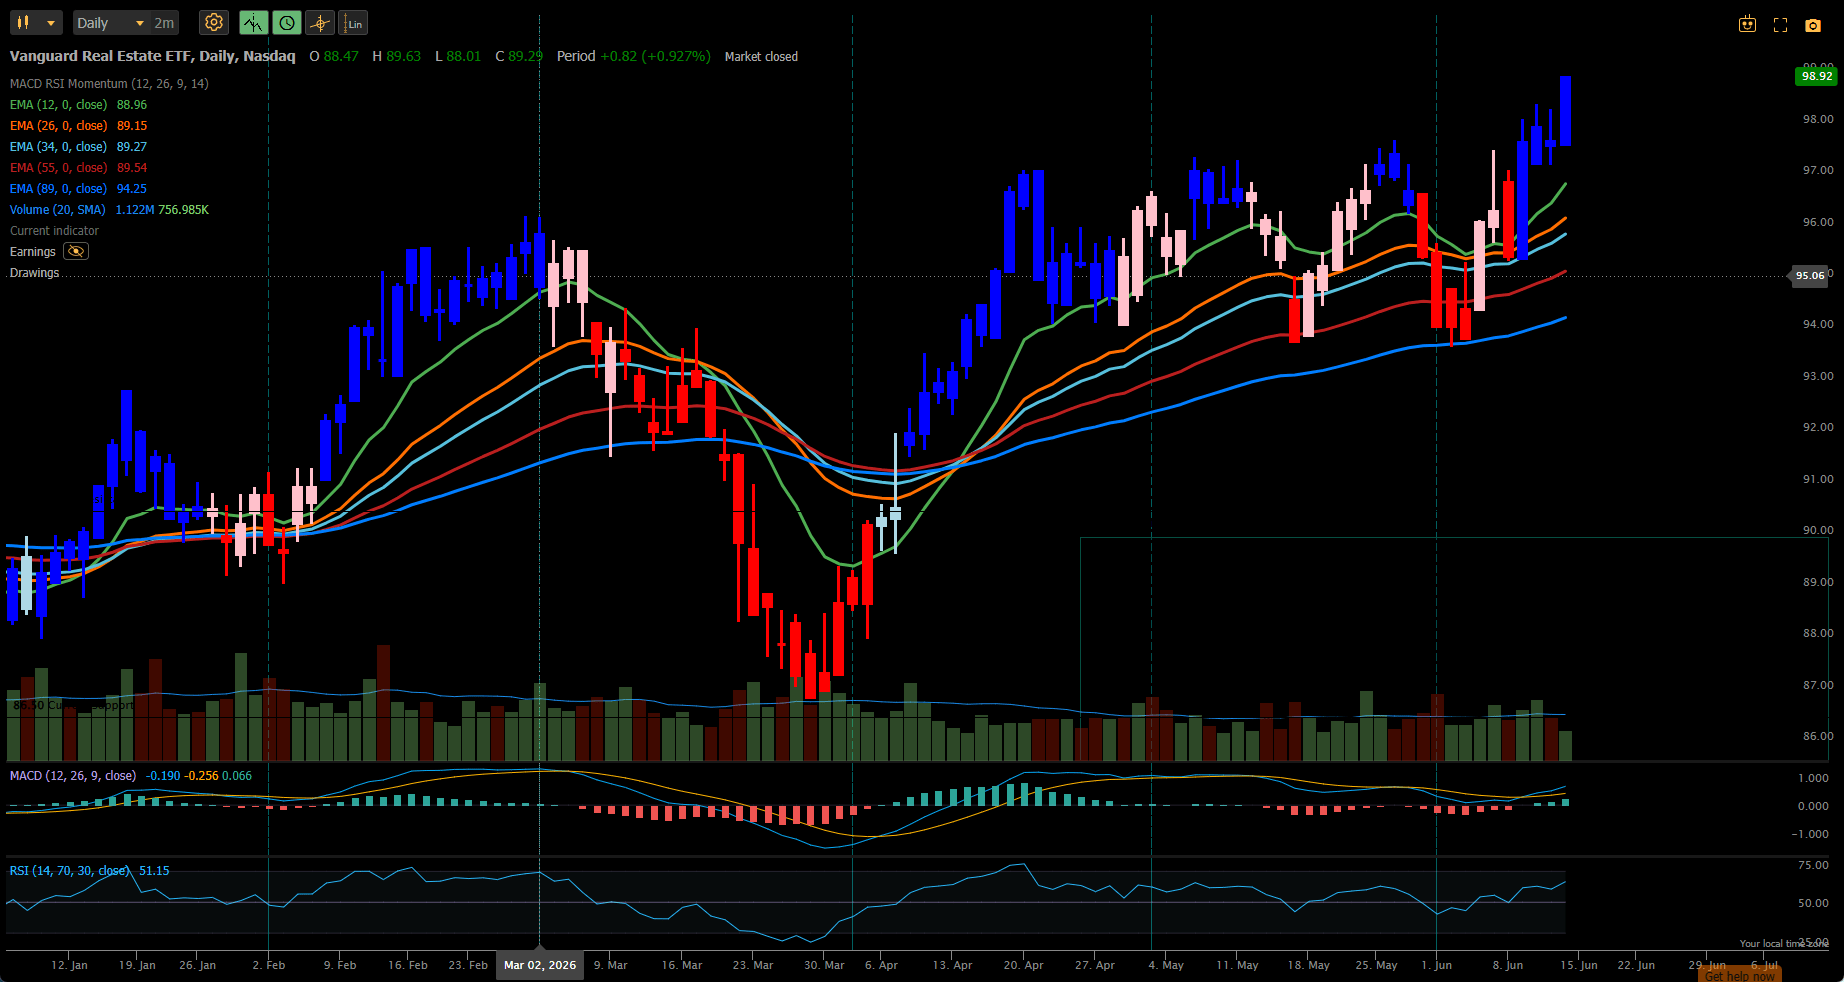
so with EMAs positively stacked, bullish short-term indicators (MACD and RSI) and a recent breakout above resistance at ~$97 I will likely add this ETF to the portfolio next week.
This just leaves SCHF that is highly ranked by the new system – and the price chart is mildly encouraging – but I will wait to see whether the current system triggers a Buy recommendation next week. It’s close, but I’ll wait for the confirmation – but likely a buy in the near future if the current trend persists.
Bottom line – performance of the portfolio to date:
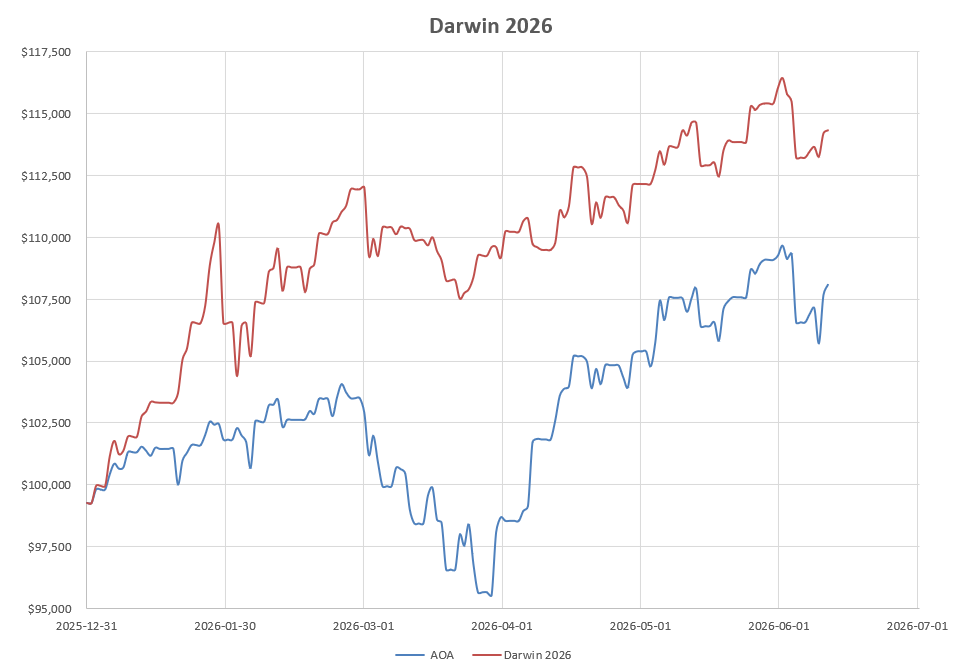 .. hanging in there – but under allocated.
Discover more from ITA Wealth Management
Subscribe to get the latest posts sent to your email.
Leave a Comment or Question