
Sculptures, Tarangoa Park, New Zealand
US Equities, as represented by the SPX (S&P 500 Index), continue to oscillate in the 7300-7600 range and closed the week ~1.5% lower than last week’s close at ~7460:
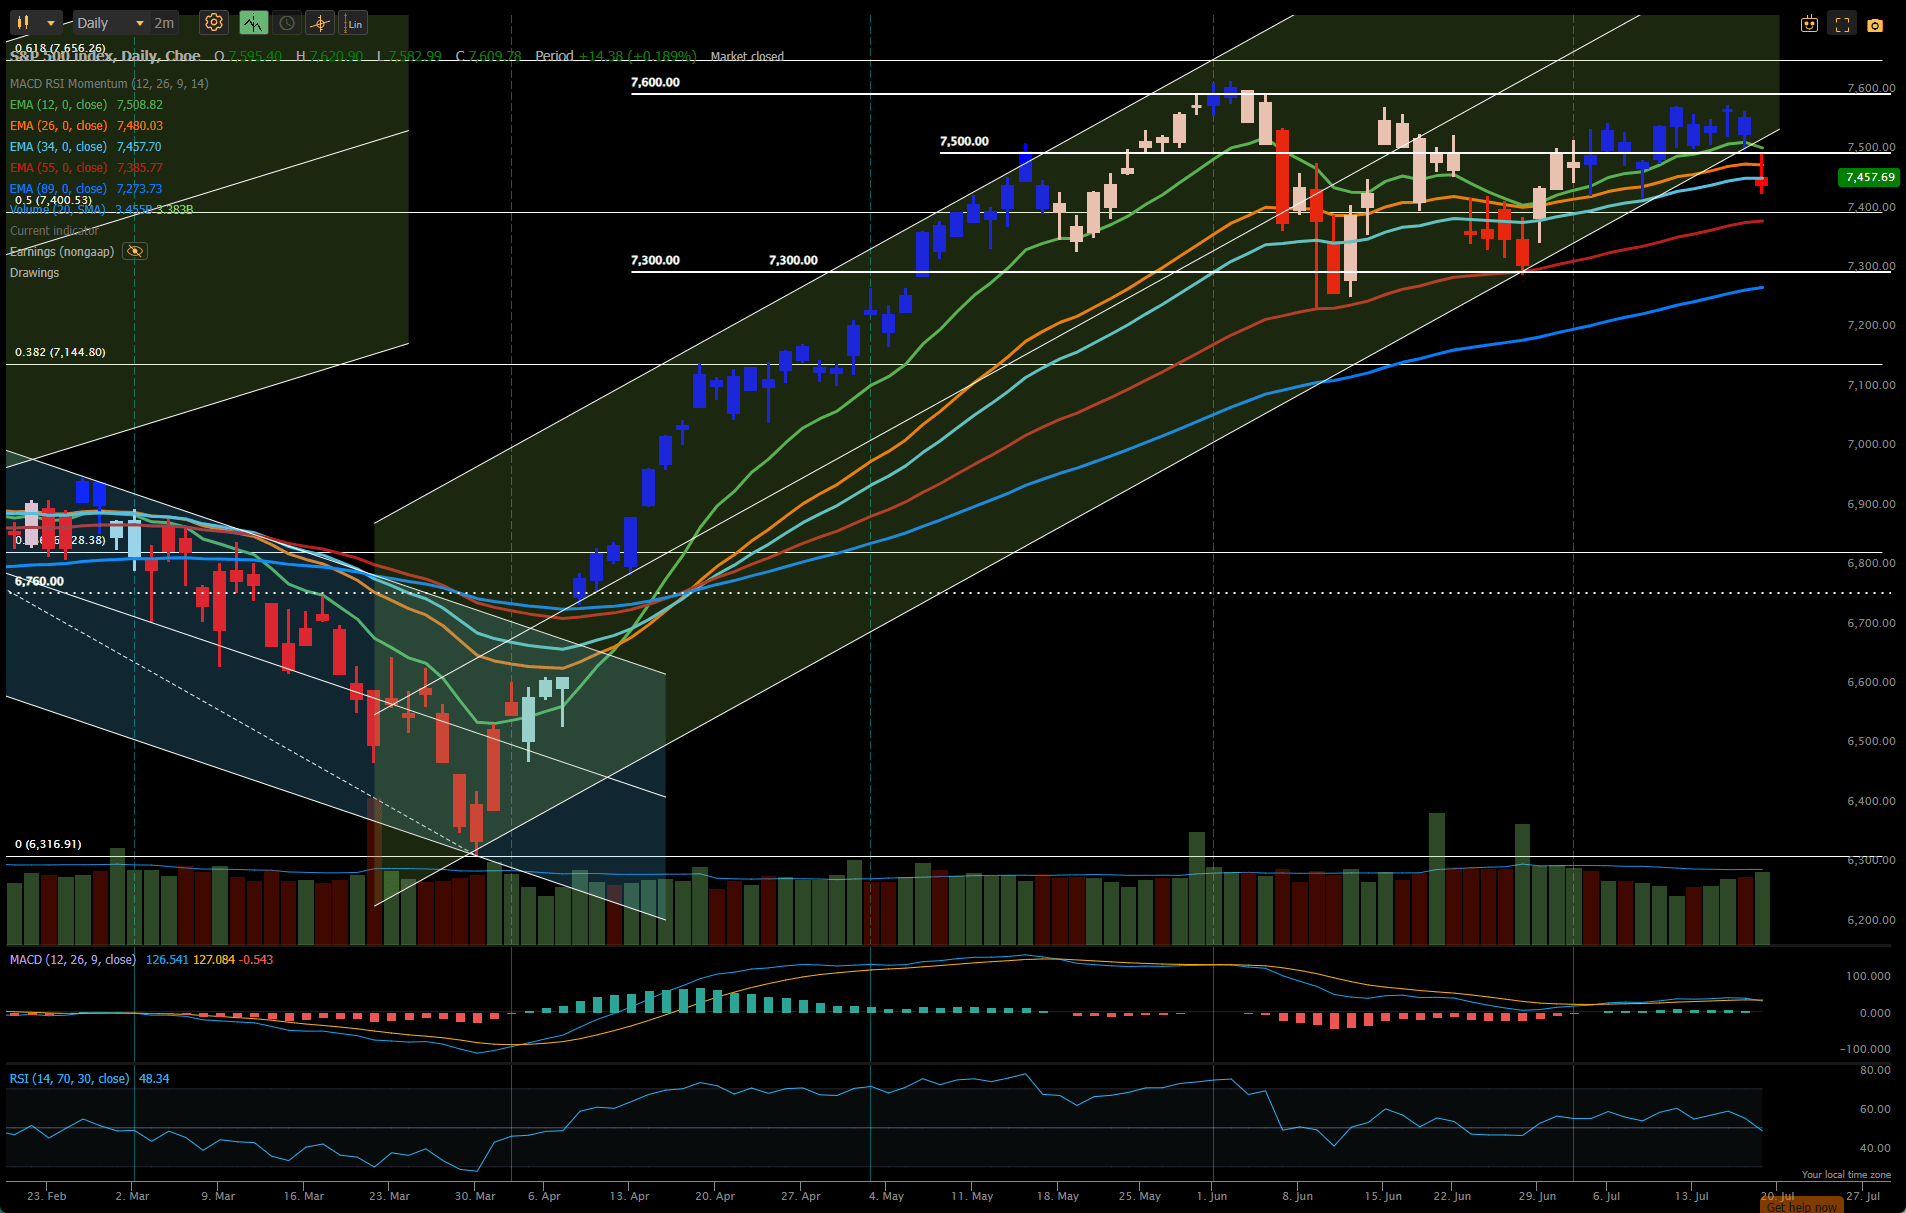
This is slightly outside of my bullish uptrend channel, as drawn, but is not below the previous pivot low so still technically in an uptrend. We are also still above the 50-period Exponential Moving Average (EMA).
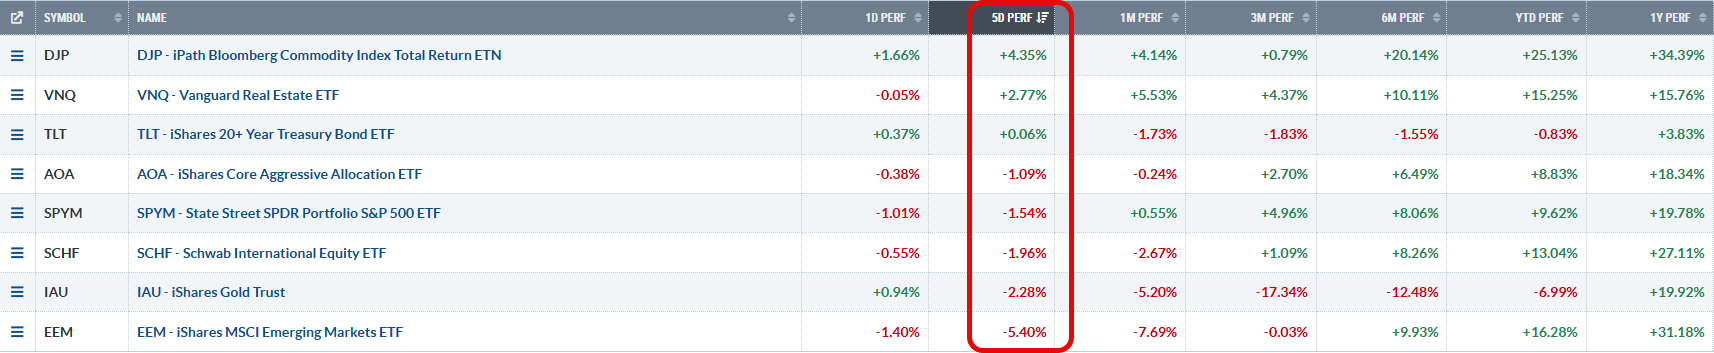
Relative to other major asset classes, US Equities lie in the middle of the performance range with Oil and Real Estate heading the list and Emerging Market Equities underperforming significantly:
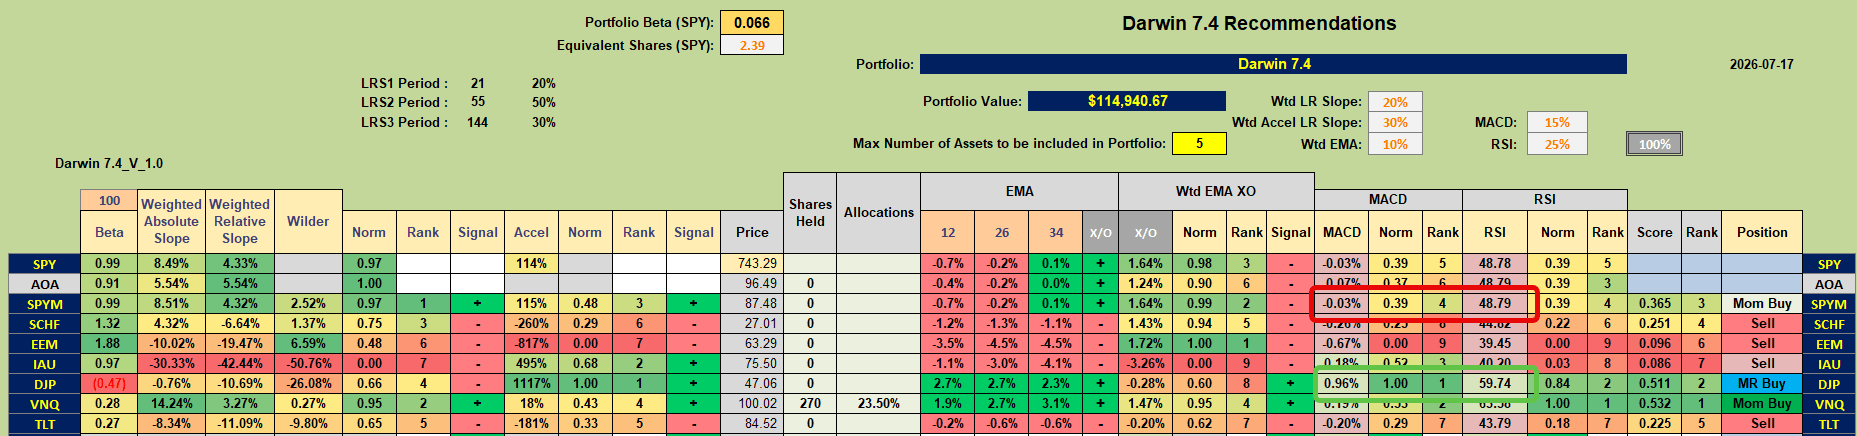
 Until this morning only VNQ (US Real Estate) was held in the portfolio but, with the analysis sheet looking like this:
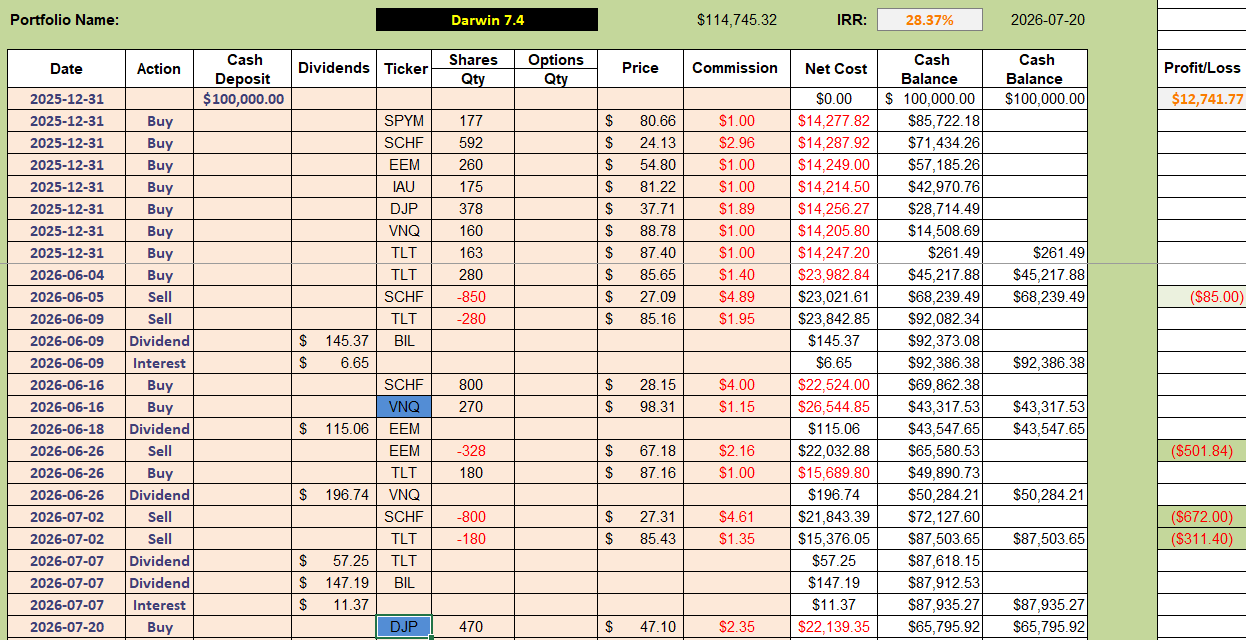
 I decided to add DJP (Commodities) to the portfolio:
 The momentum/acceleration graphs for DJP look like this:
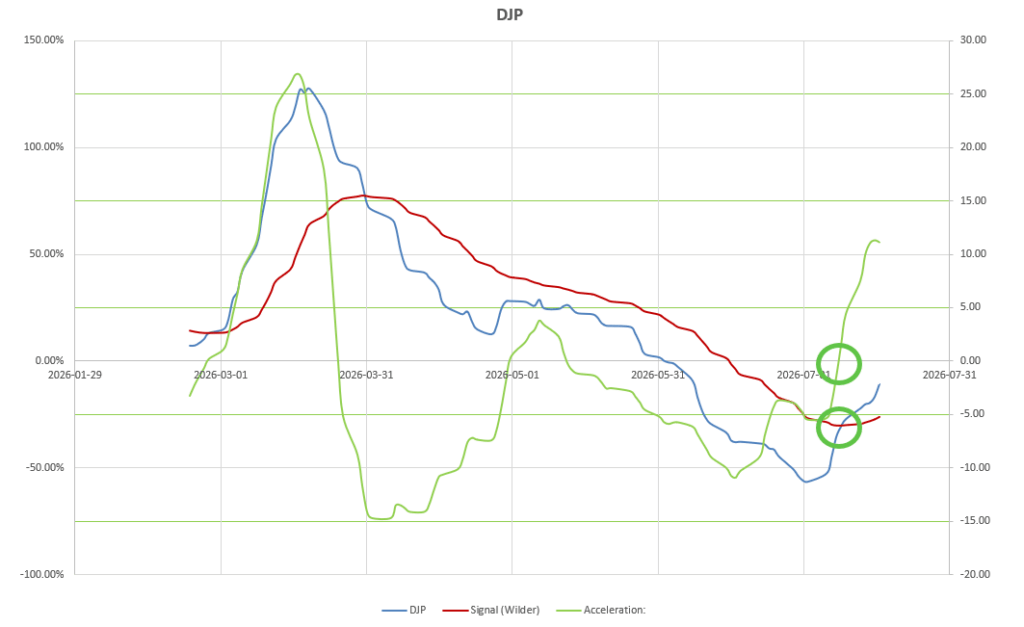 with recent “Buy” signals from both measurements and positive support from the shorter-term MACD and RSI indicators (green box in analysis screenshot above).
SPYM (US Equities) is also showing positive signals on the momentum/acceleration charts:
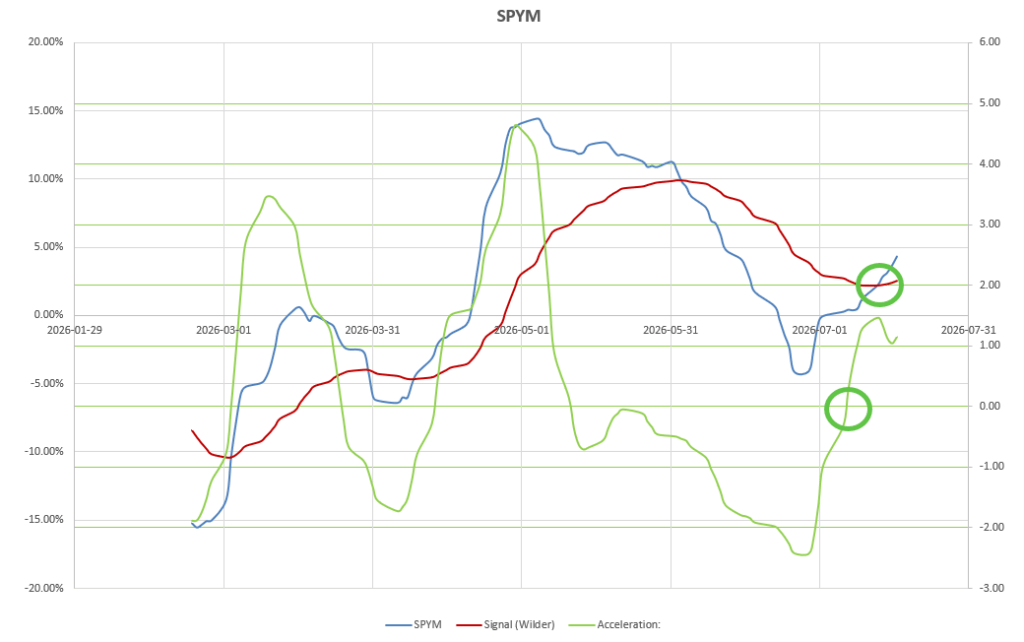 but is not supported by the shorter-term MACD and RSI indicators (red box in analysis screenshot) – plus, we know that equities are in a consolidation phase from the price chart at the beginning of this post. I am therefore waiting for some evidence of a breakout before adding this ETF to the portfolio.
Performance of the Darwin Portfolio to date looks like this:
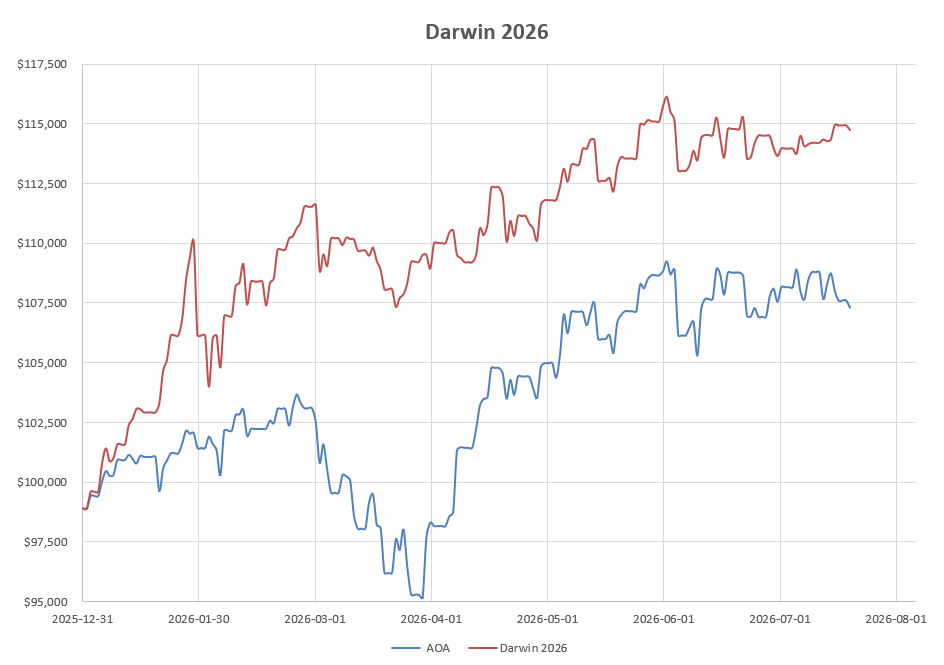 with a healthy 28% IRR year-to-date.
I am still looking for a simpler system to manage this portfolio but have not yet been able to come up with something that can beat the performance of the system presently being used.
Discover more from ITA Wealth Management
Subscribe to get the latest posts sent to your email.
Leave a Comment or Question