
Goin’ Fishin’ – by Canoe
After hitting more all-time highs at the beginning of the week the SPX (S&P 500 Index) bounced off the ~7600 resistance level and closed the week ~2.5% lower than last week’s close:
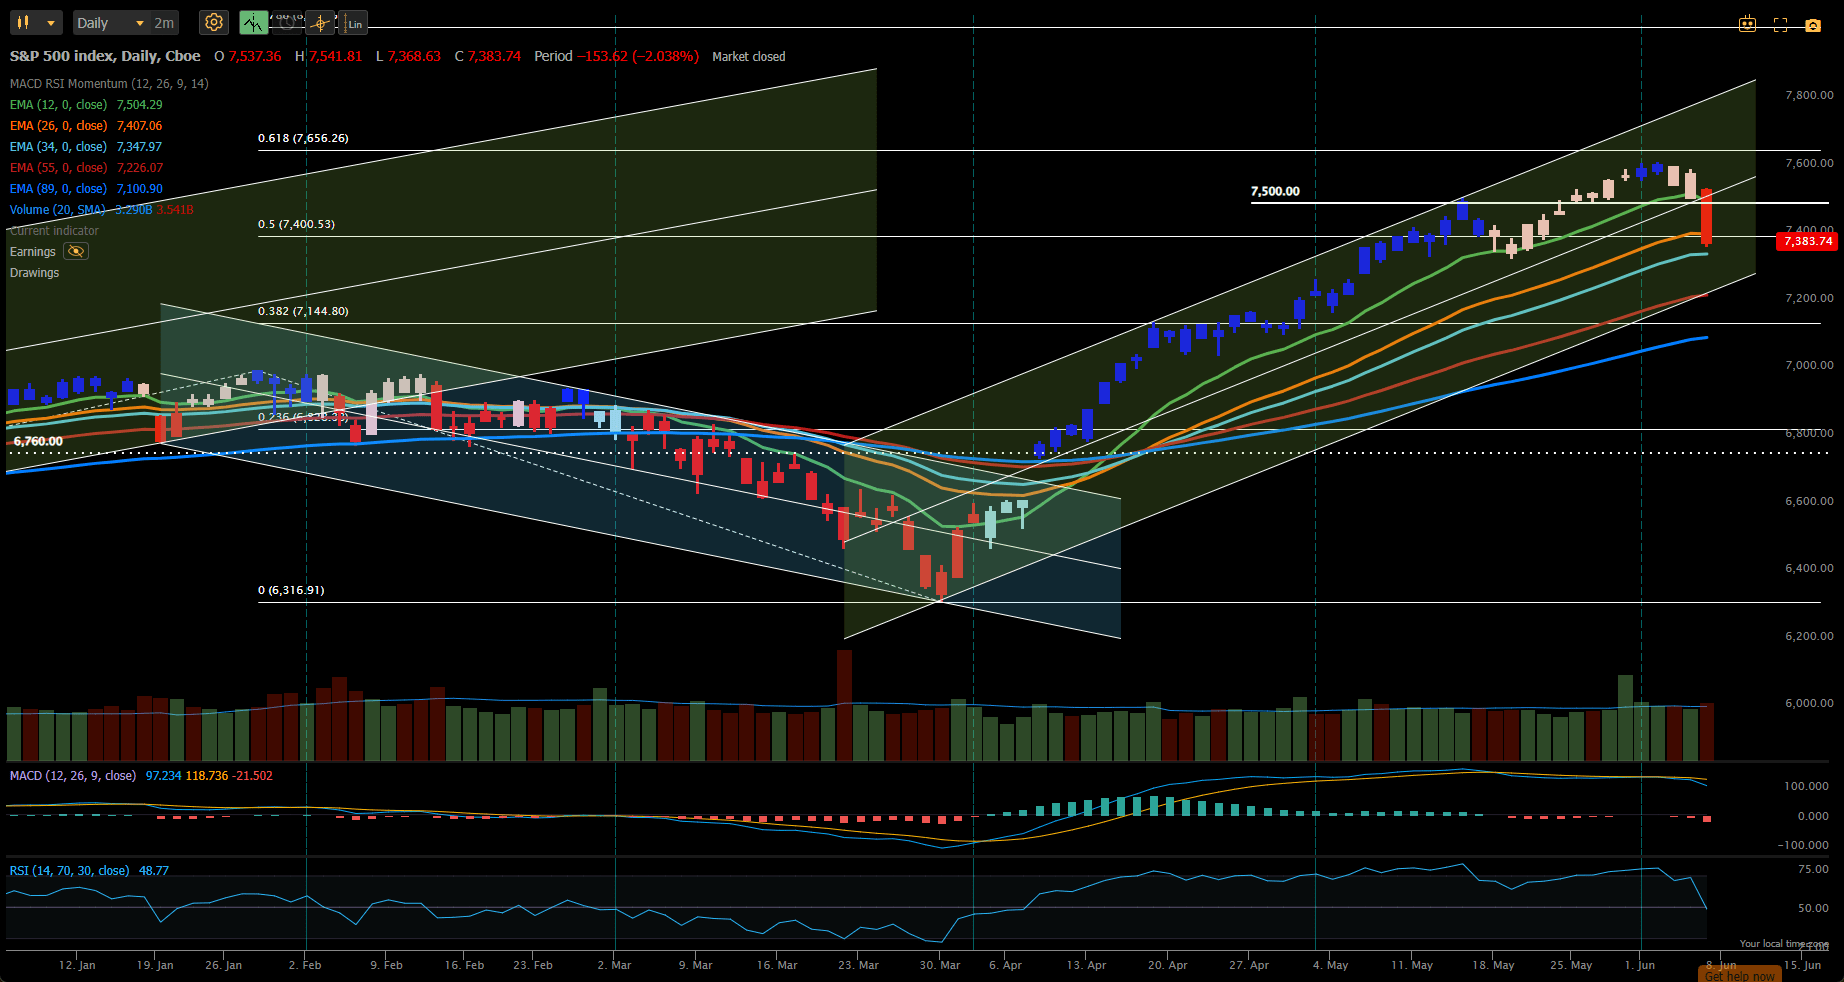
We are now sitting at ~7400 that provided some level of resistance in early May before breaking through to new highs. We now wait to see whether this will provide support from above or whether we pullback further towards what looks like potentially stronger support at~7150 – this would be a ~6% pullback from the highs and still not a “correction” – that would require a pullback to ~6840 – that also happens to be a ~61.8% Fibonacci retracement of the current trend range. Because we broke out of the uptrend channel that I had been showing in previous posts and since this was a very narrow channel I have redrawn the bullish channel in the above screenshot to focus on the highs rather than the lows (of which there weren’t too many well-defined pivots). This is still a strong uptrend channel with the lower boundary sitting at ~ the 50-period EMA line and above the 7150 level mentioned above.
In terms of relative performance, US Equities fared better than it’s international equity competition:
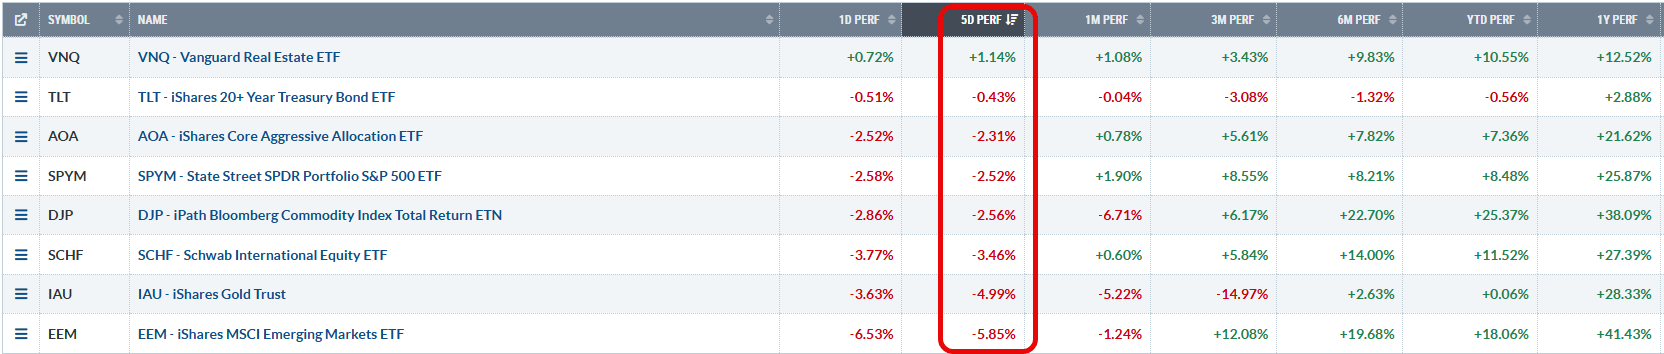 with only US Real Estate showing positive returns on the week.
The Darwin analysis sheet currently looks like this:
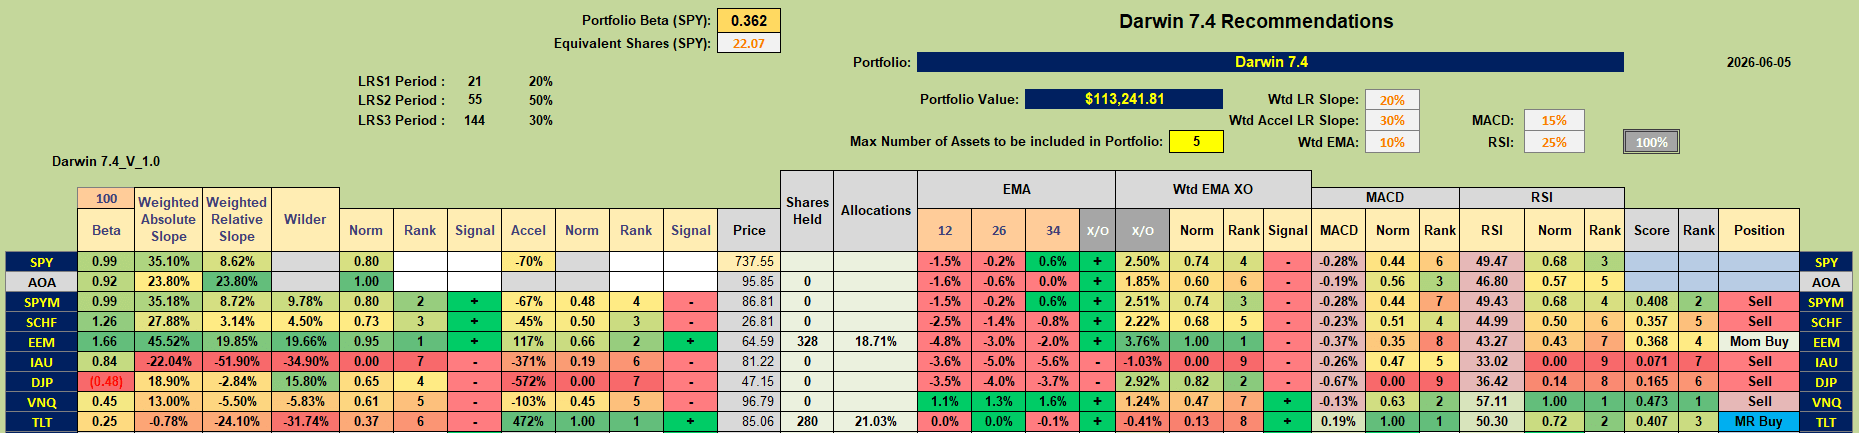 with Buy recommendations on only EEM (Emerging Market Equities) and TLT (US Long term treasuries).
This means that I had to make some adjustments during the week that look like this (red box):
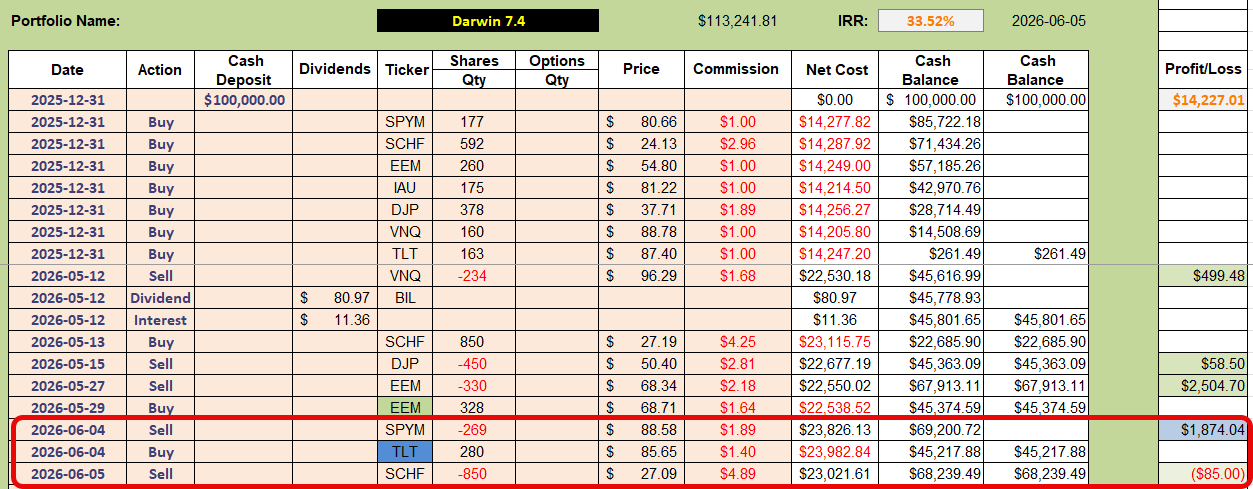 On Thursday I sold my position in SPYM (US Equities), locking in $1,874 in profits, and replaced it with a position in TLT (Bonds). Then, on Friday, I closed my position in SCHF (Developed Market Equities).
Let’s take a look at the charts that encouraged me to make these decisions. First, SPYM:
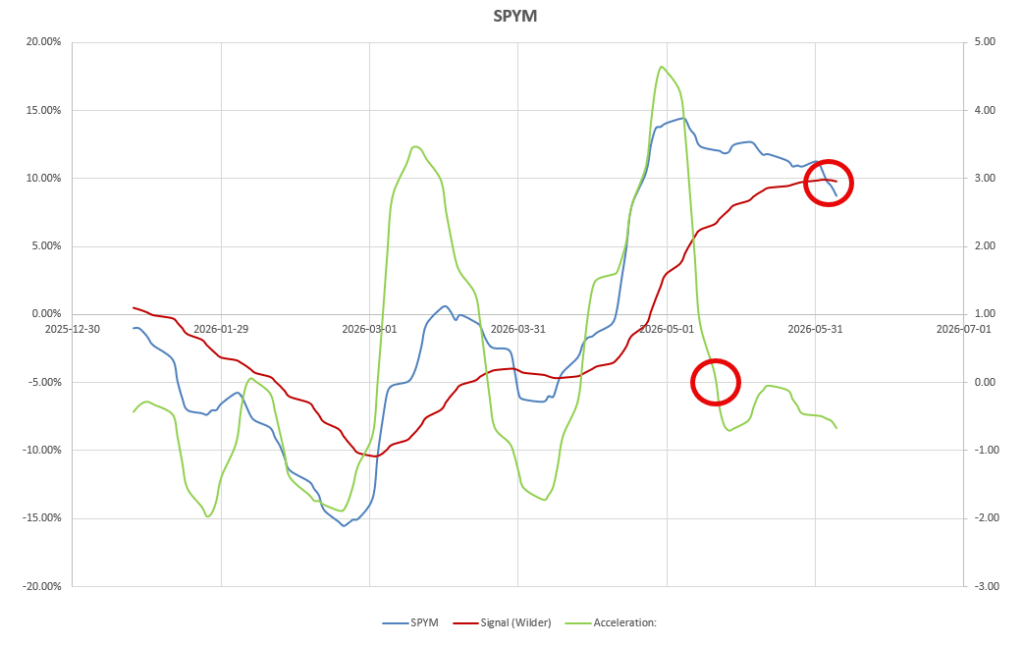 where we see that, although acceleration (green line) had turned negative ~ 3weeks ago, momentum (blue line) had remained in strong positive territory and had not dropped below it’s 14-period Wilder Moving Average (brown line). However, this changed on Thursday and reinforced my decision to sell.
At the same time, TLT was moving in the opposite direction:
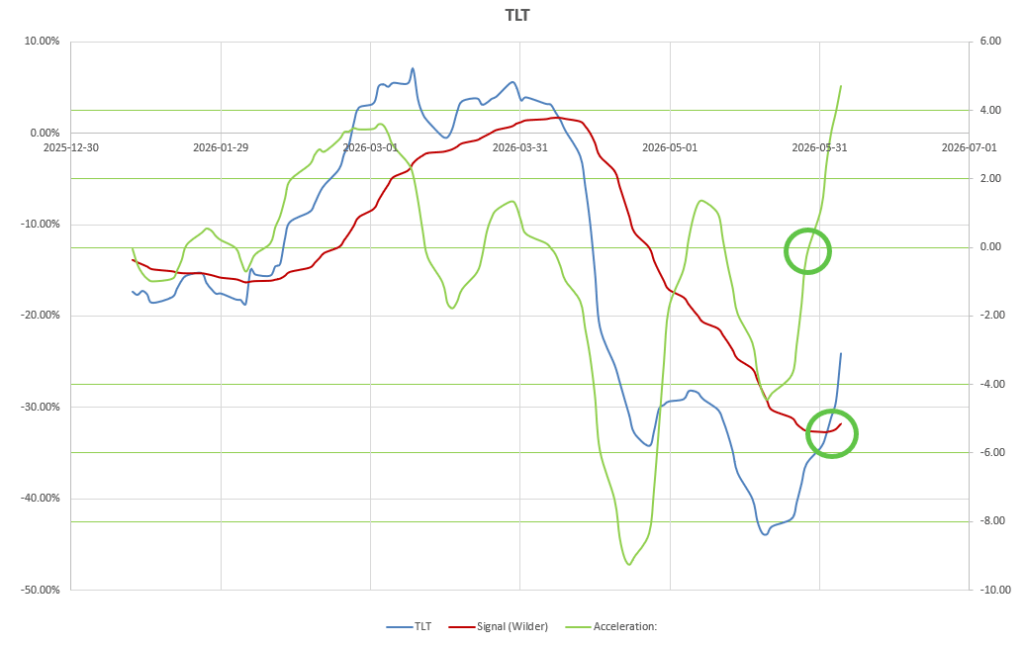 with positive acceleration and momentum (although in negative territory on a relative basis) crossing above it’s Wilder MA. This is a mean reversion entry.
Checking on SCHF:
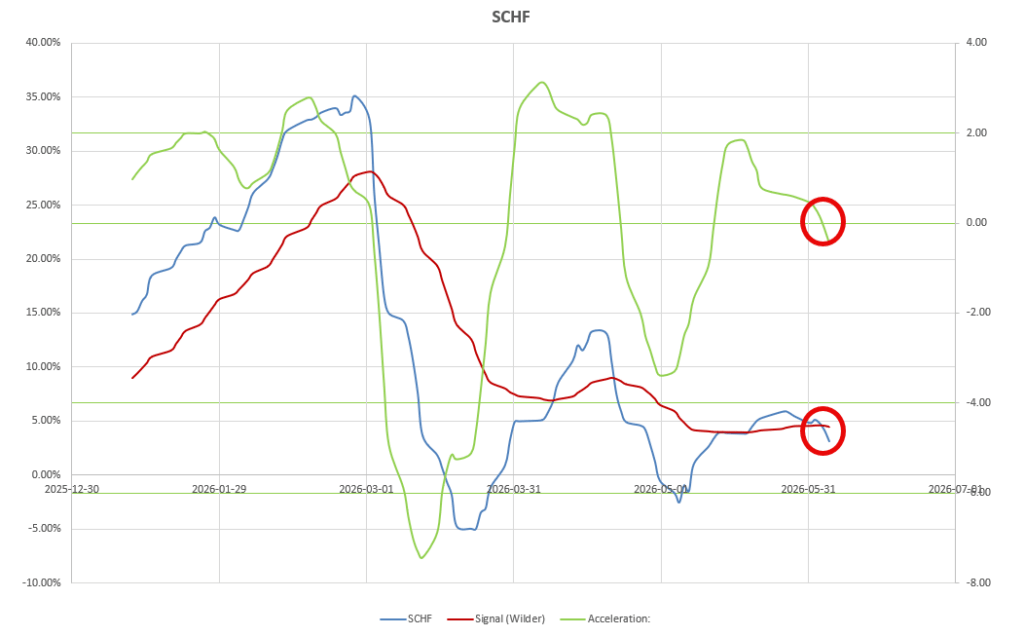 this looks similar to SPYM but I waited an extra day for confirmation before selling. In both cases (SPYM and SCHF) the MACD and RSI short-term indicators were negative so I could easily have sold both on Thursday. This would have saved me the $850 loss that I took when selling on Friday.
Emerging Markets took the biggest hit this week – but was not big enough to generate a sell recommendation:
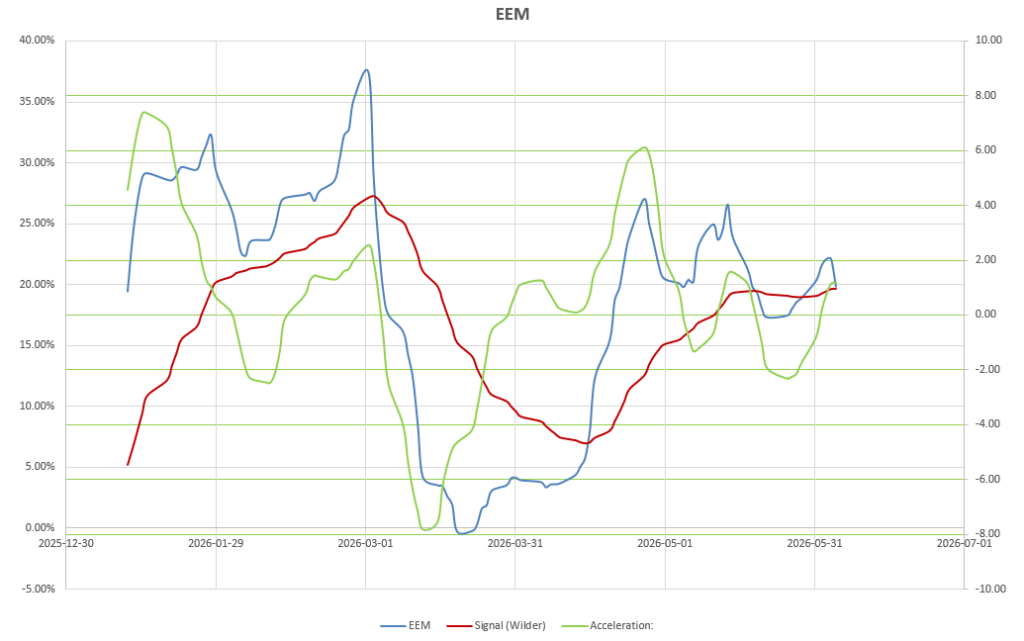 .. but this looks likely for next week.
This is all reflected in the performance chart:
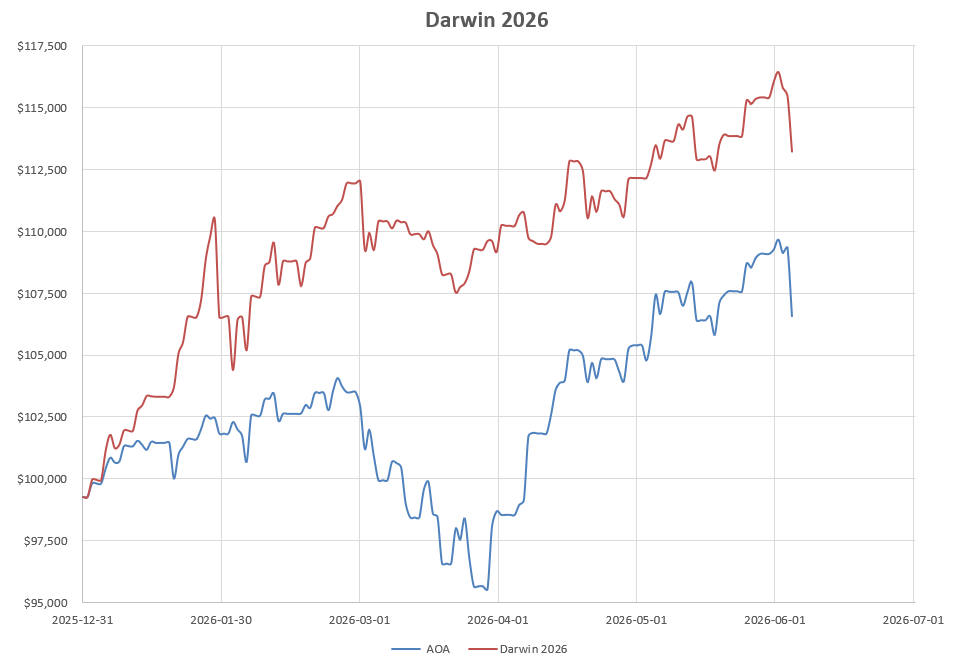 and keeps us ahead of the broader market benchmark.
Discover more from ITA Wealth Management
Subscribe to get the latest posts sent to your email.
Leave a Comment or Question