
Waiting for the “Maestro”, Budapest, Hungary
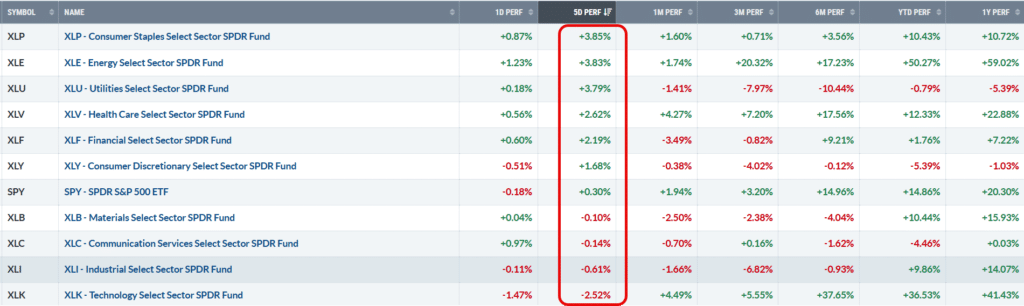
US Equities continue to consolidate in a narrow range – with the SPX (S&P 500 Index) having tested previous all-time highs last week. Over the past week there was evidence of a rotation into more defensive sectors with Consumer Staples, Energy and Utilities topping the list and Tecknology, that has been leading the market, falling to the bottom:
 The current analysis sheet for the Dirac Portfolio looks like this:
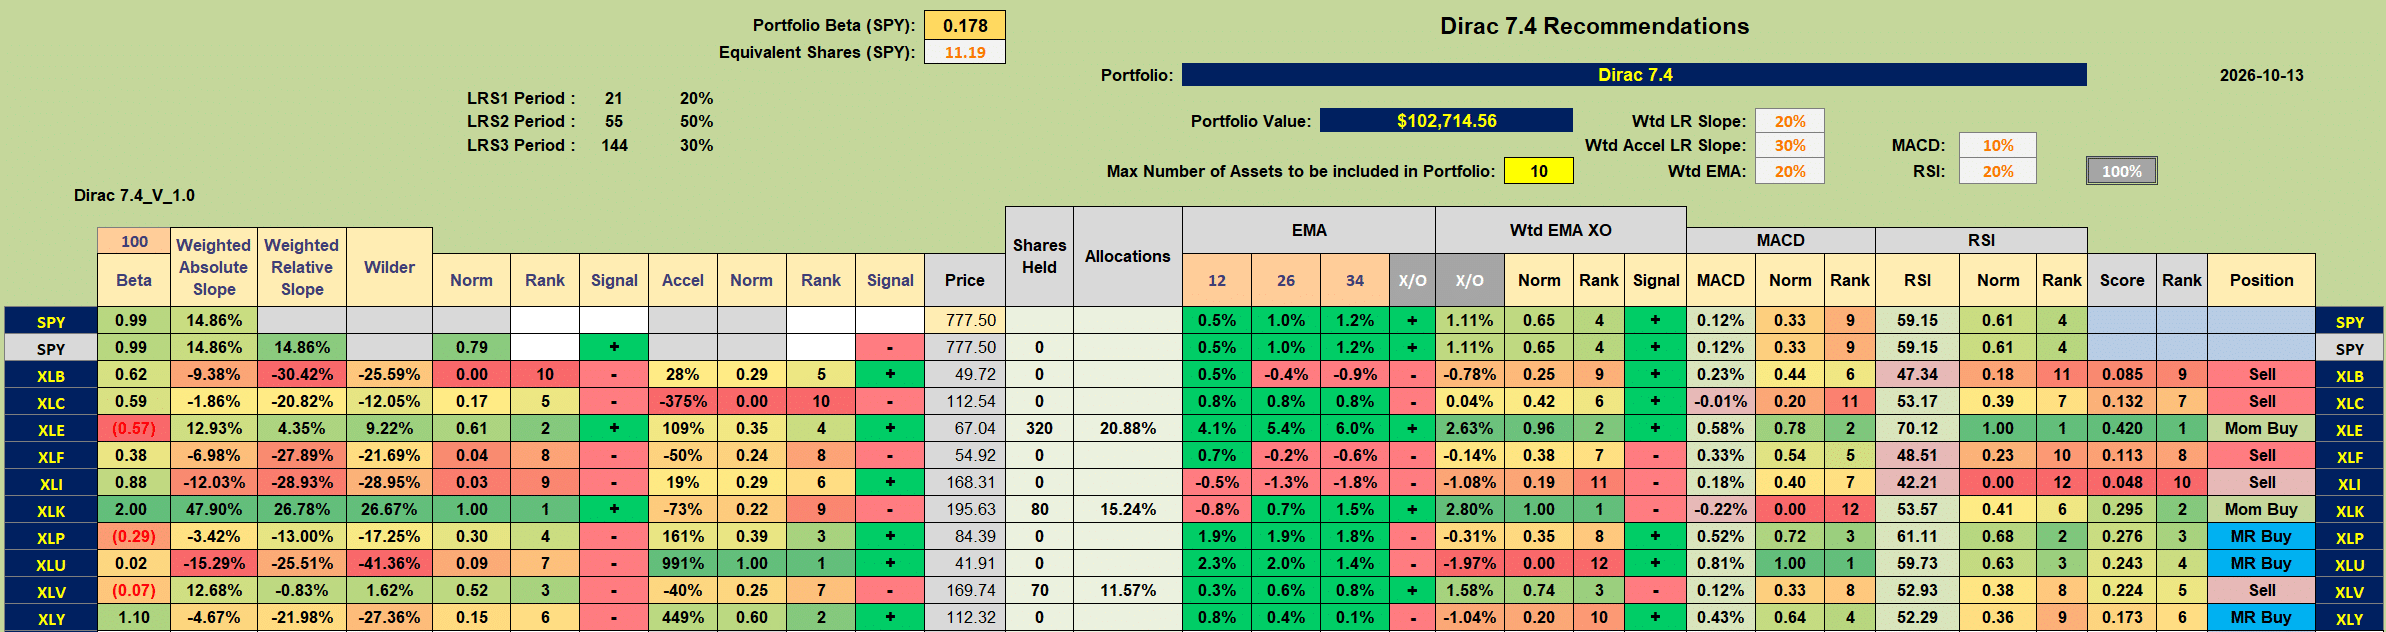 with XLE (Energy) and XLK (Technology) recommended as Momentum Buys and XLP (Consumer Staples), XLU (Utilities) and XLY (Consumer Discretionary) suggested as Mean Reversion Buys – bottom fishing. XLC (Communications) comes as a recommended Sell so let’s take a look at this first. The momentum/acceleration graphs look like this:
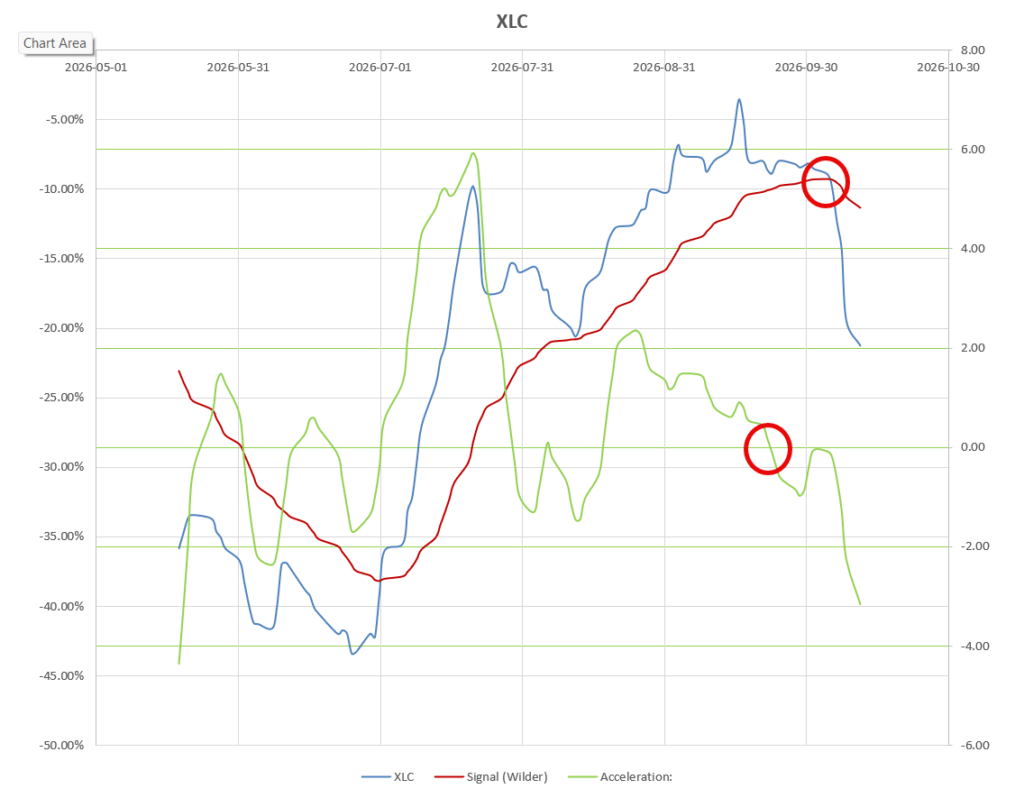 having triggered sell signals on both momentum and acceleration measurements. A final check on the price charts:
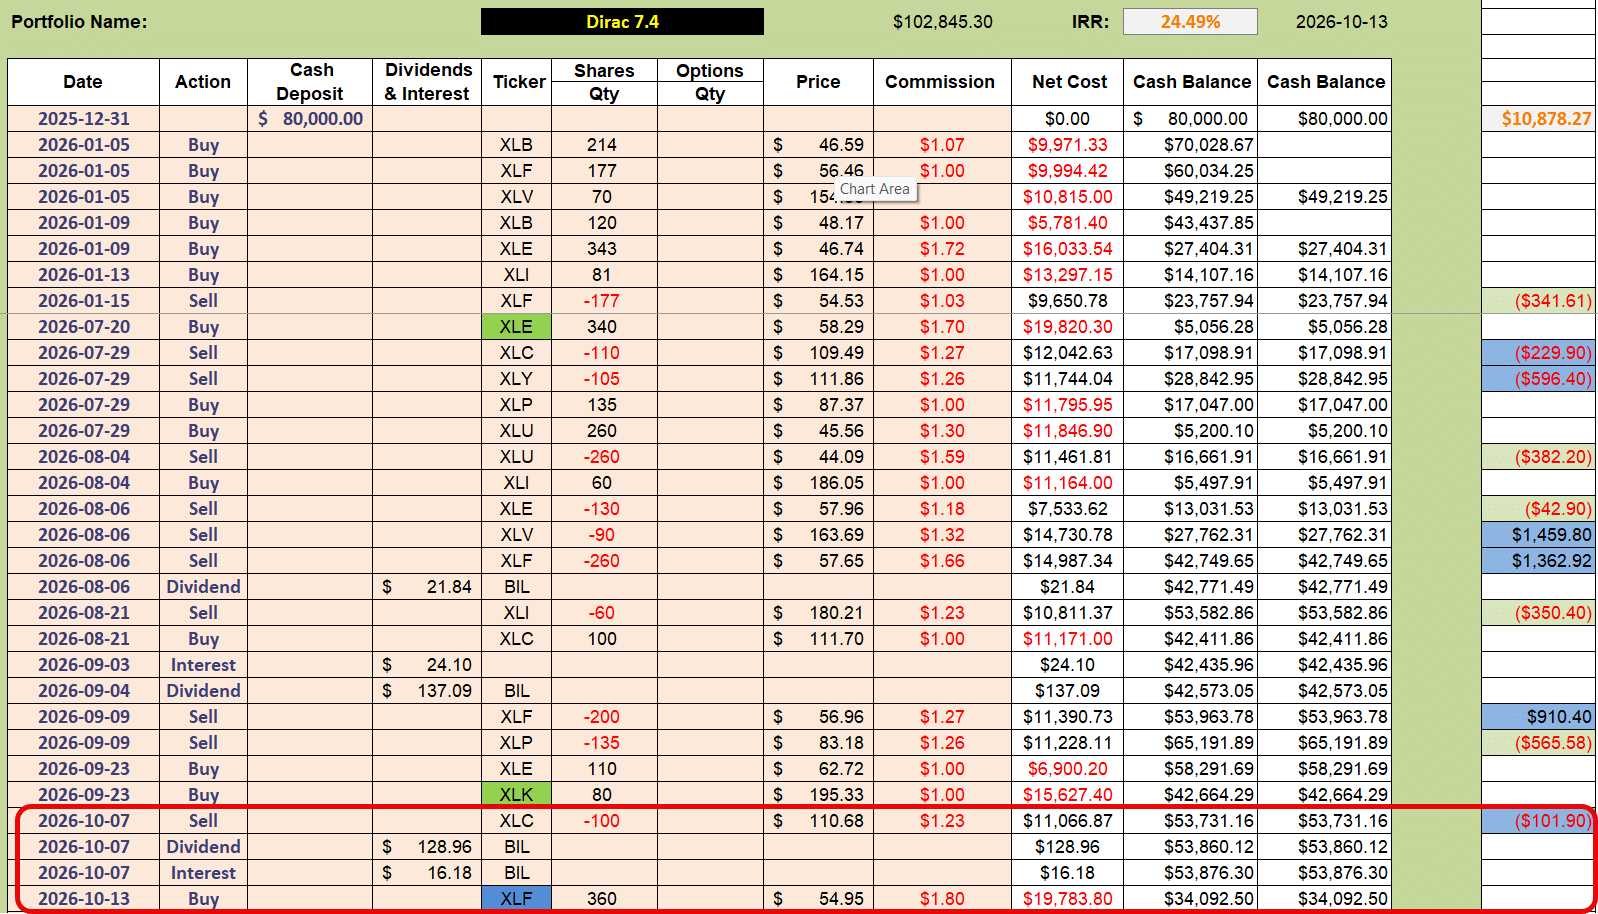
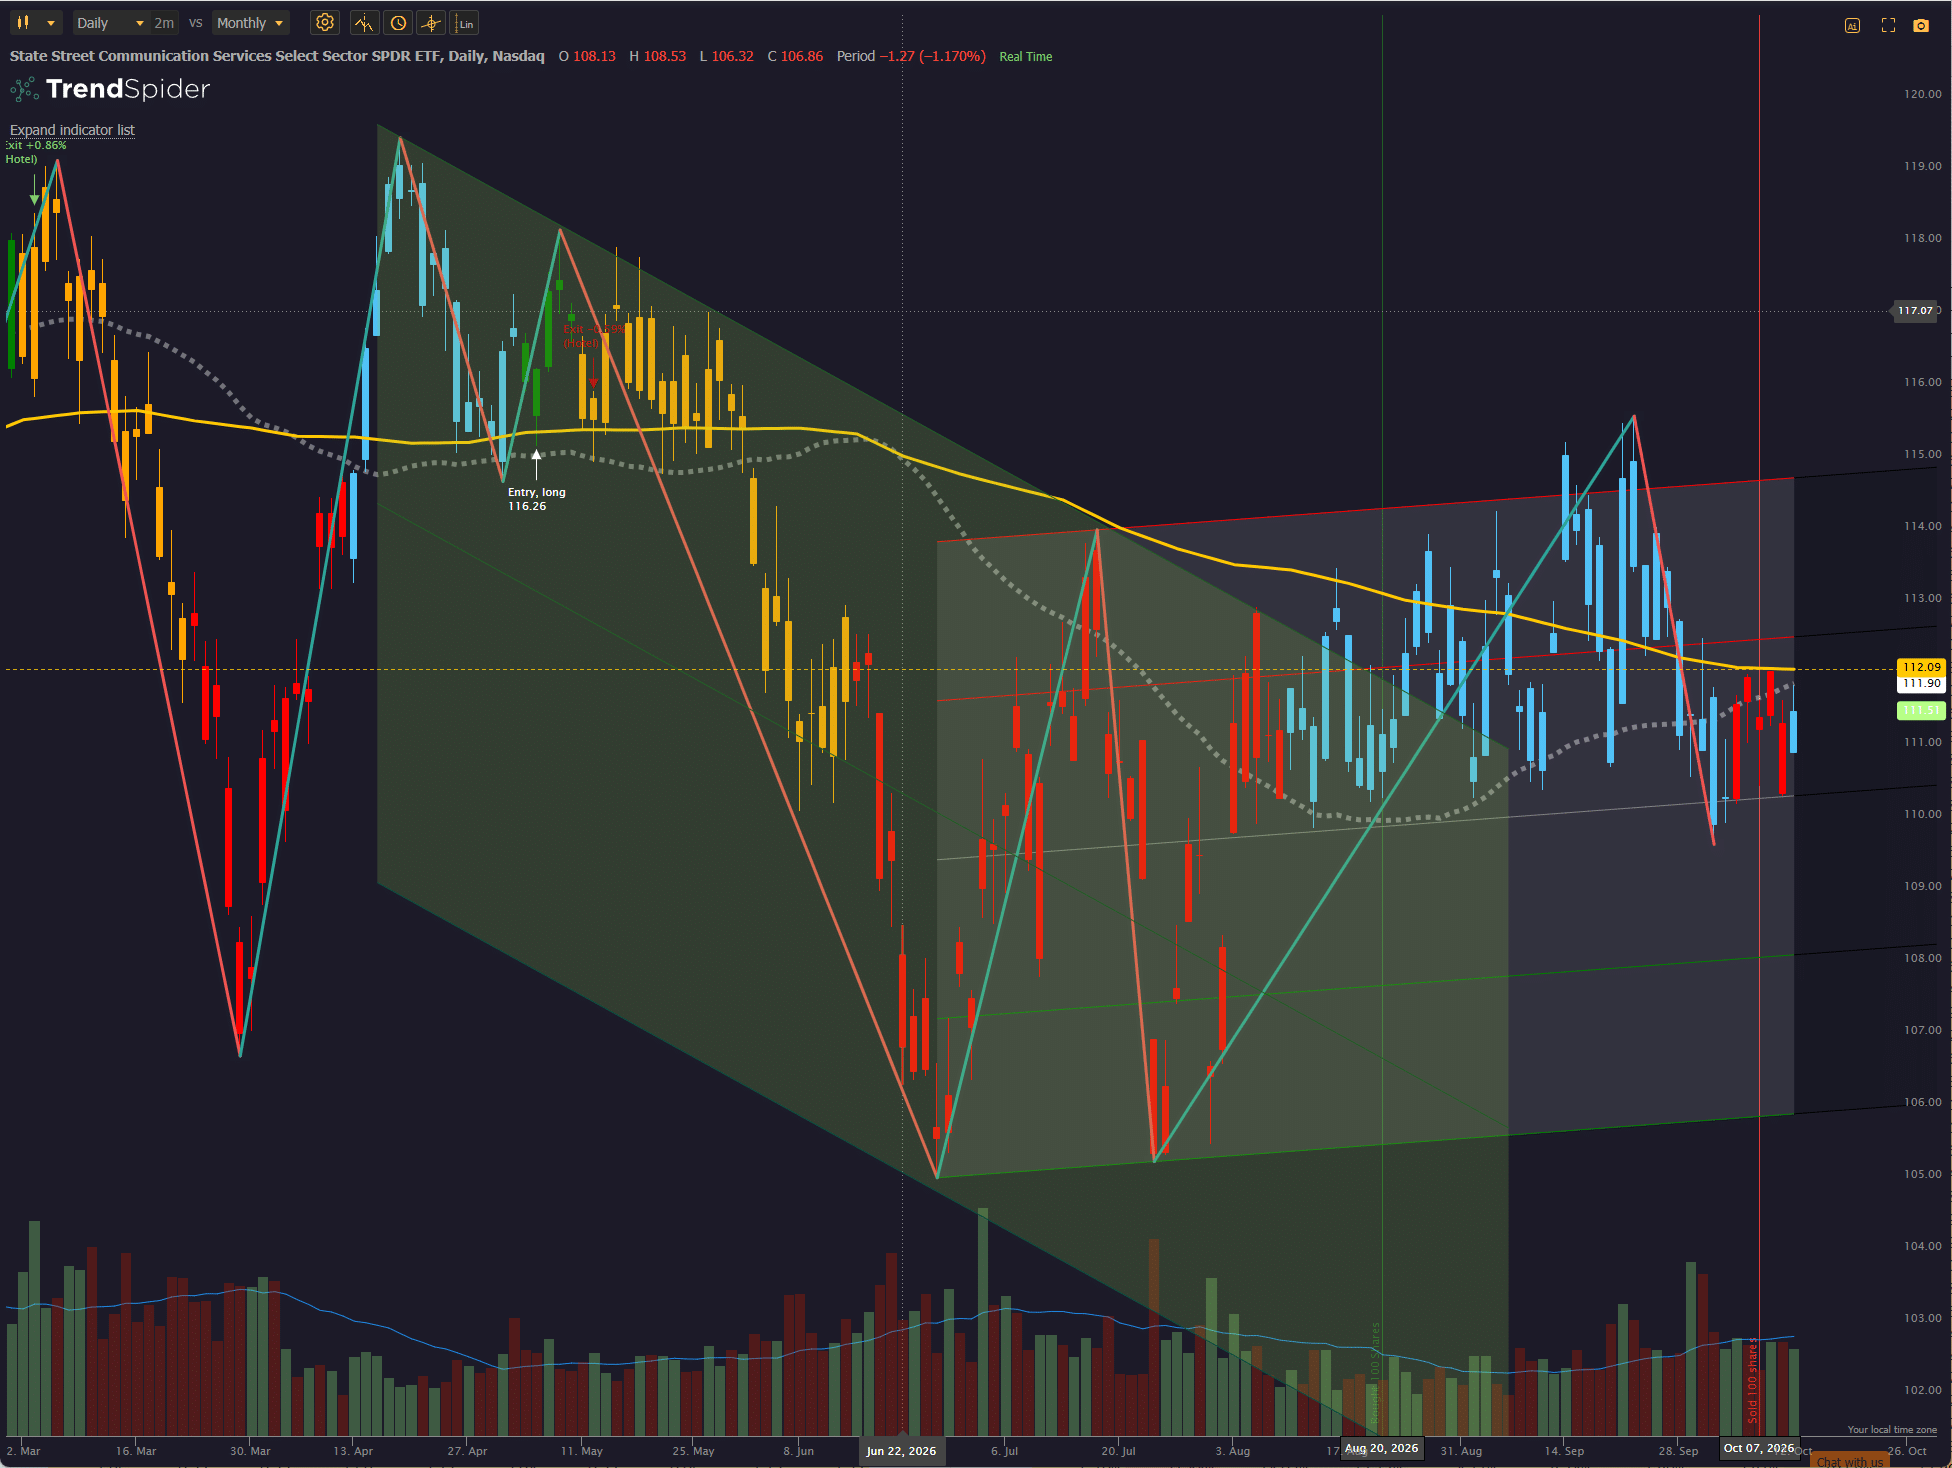 shows XLC pulling back after an attempted breakout from the earlier bearish channel and now fluctuating between the Weinstein Stage 1 and Stage 4 regimes. This is not in strong Buy territory, so I chose to sell my existing position in this sector on 7 October with a small (~$100) loss:
 XLK, although showing signs of short-term weakness, is still looking positive – but worth watching closely for any further bearish signs.
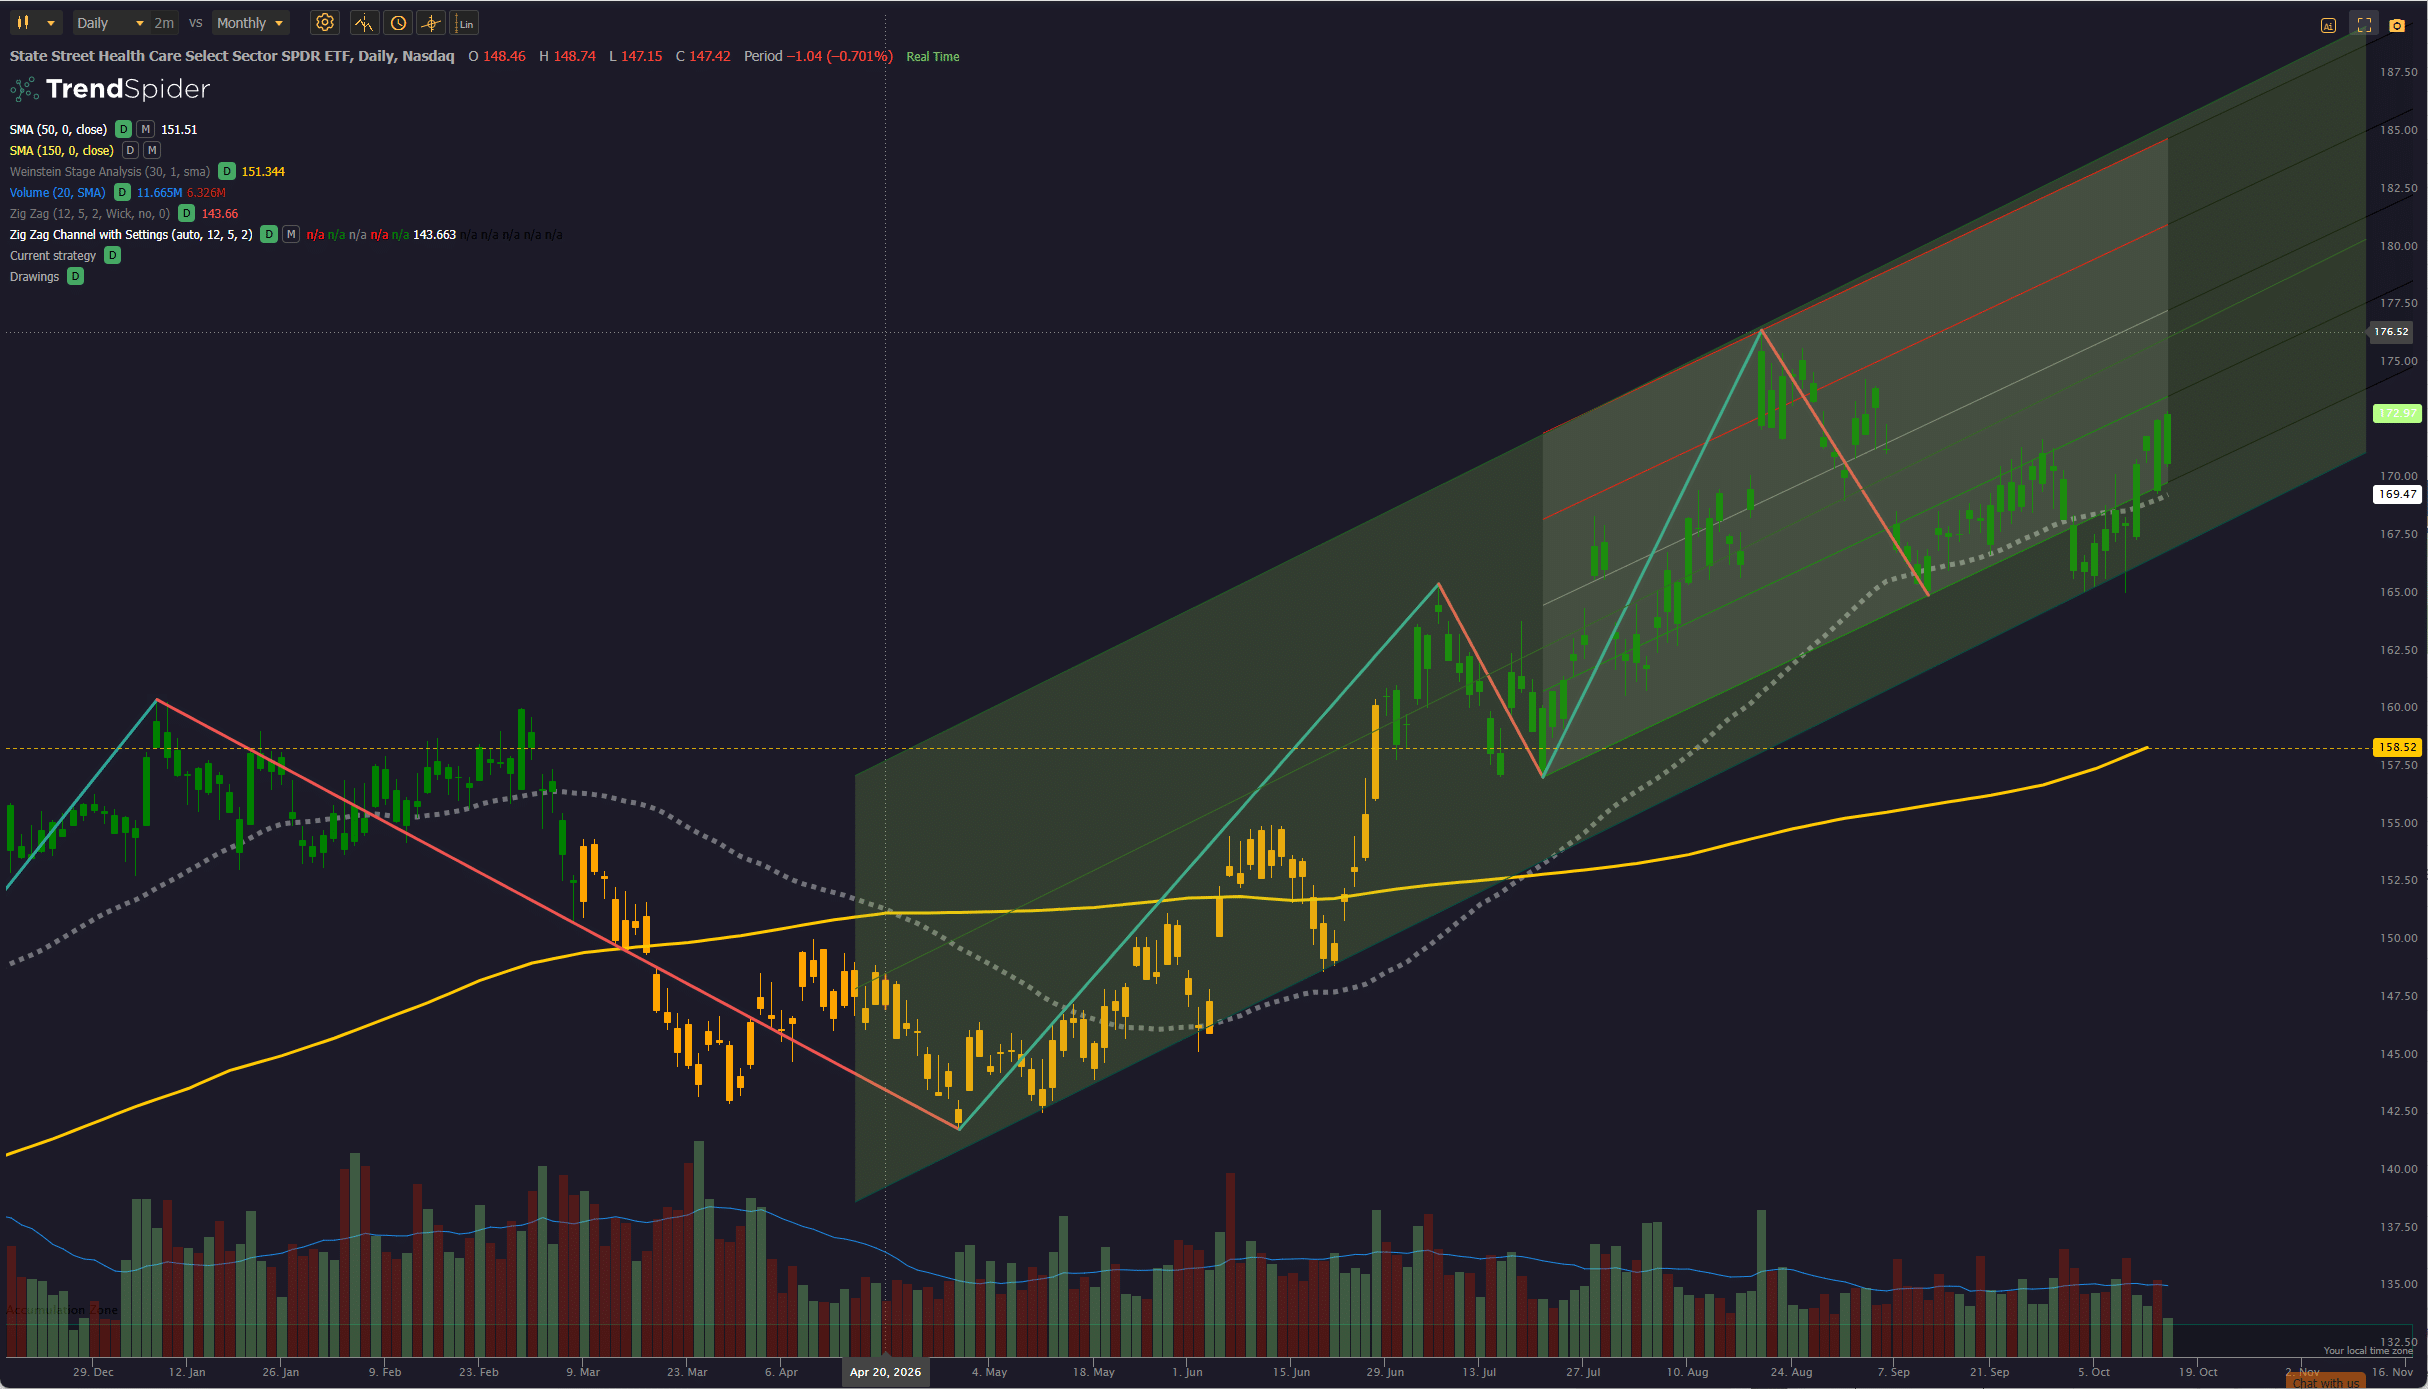
Although XLV is showing as a recommended Sell, a look at the price chart still shows it trading in a Weinstein Stage 2 bullish range and at this point there seems to be no obvious reason to sell – so I have chosen to Hold this position:
 Checking next on the new suggested Buy recommendations, XLU momentum/acceleration graphs look like this:
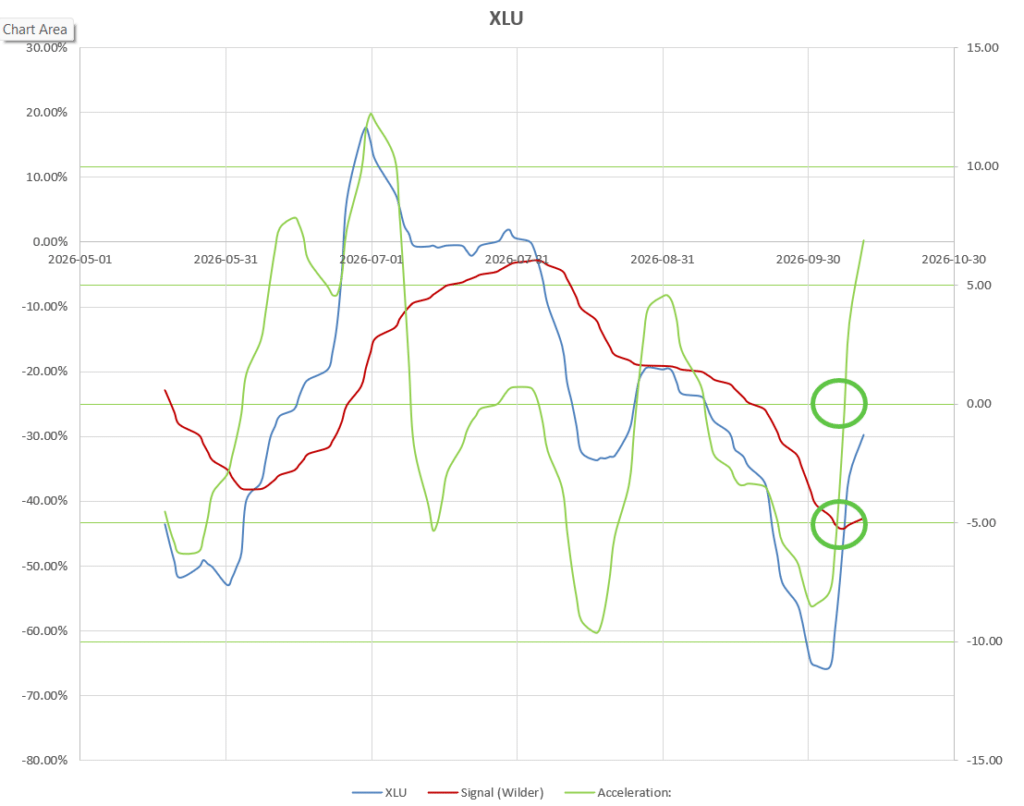 but with price still within the Weinstein Stage 4 range (red bars) even though showing a bounce after breaking below the lower boundary 0f the bearish channel:
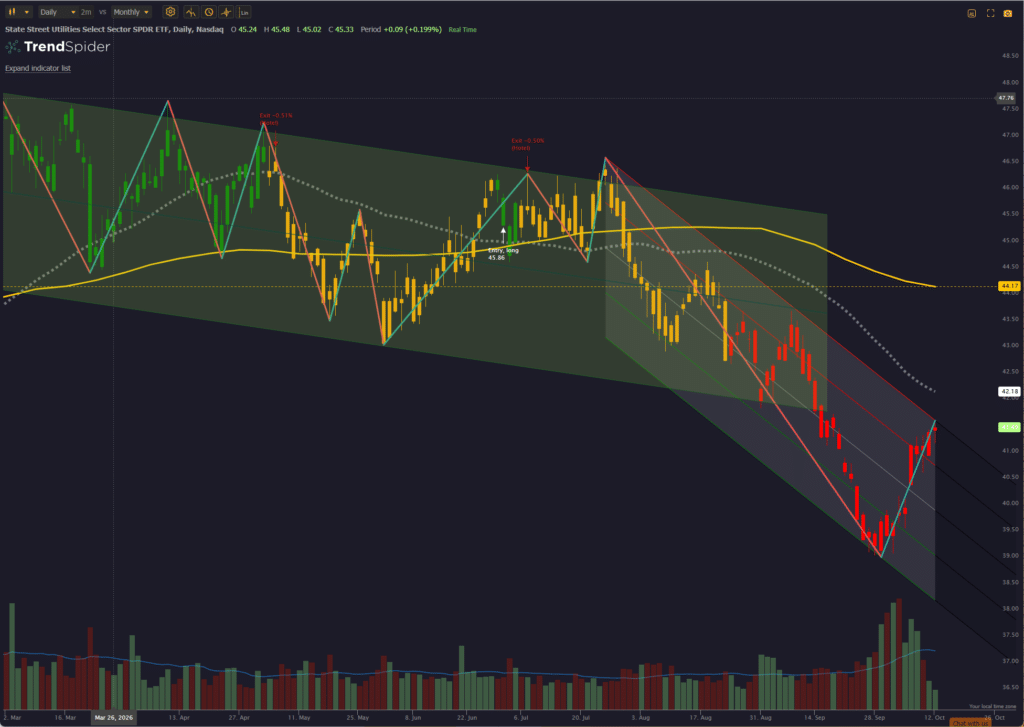
worth watching from here, but I have decided not to add a position in the Utility sector at this point until I see a little more confirmation/strength.
Similarly, XLY (Consumer Discretionary) shows a similar pattern with momentum/acceleration looking like this:
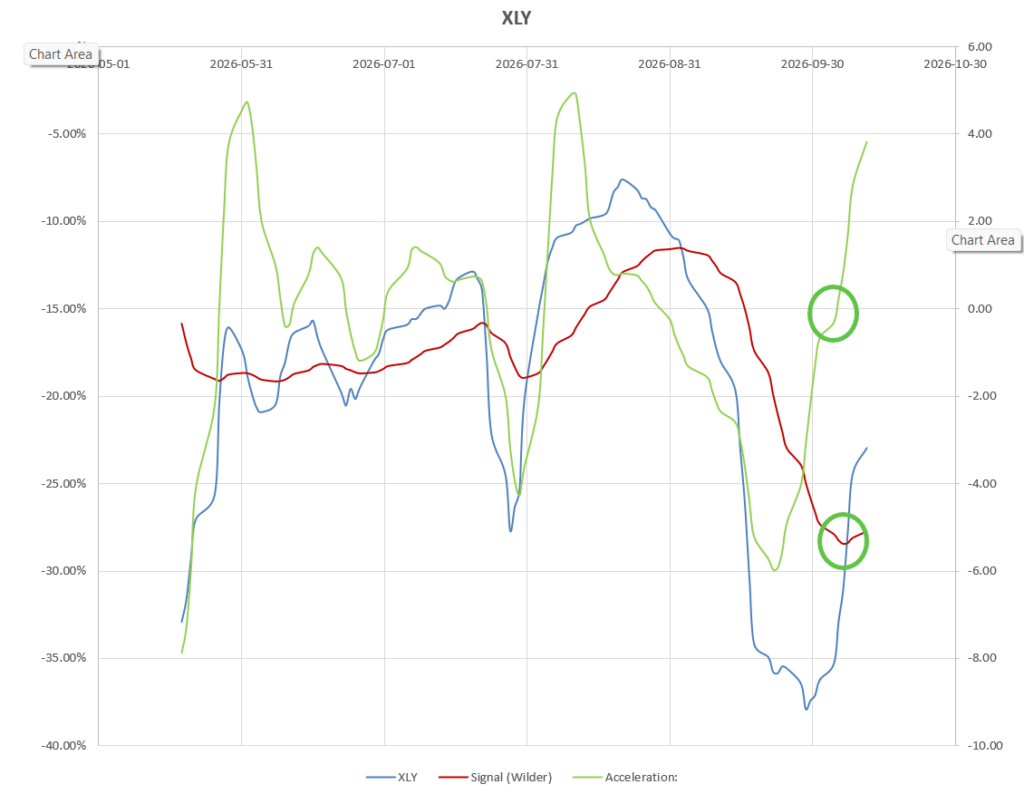 and the price chart like this:
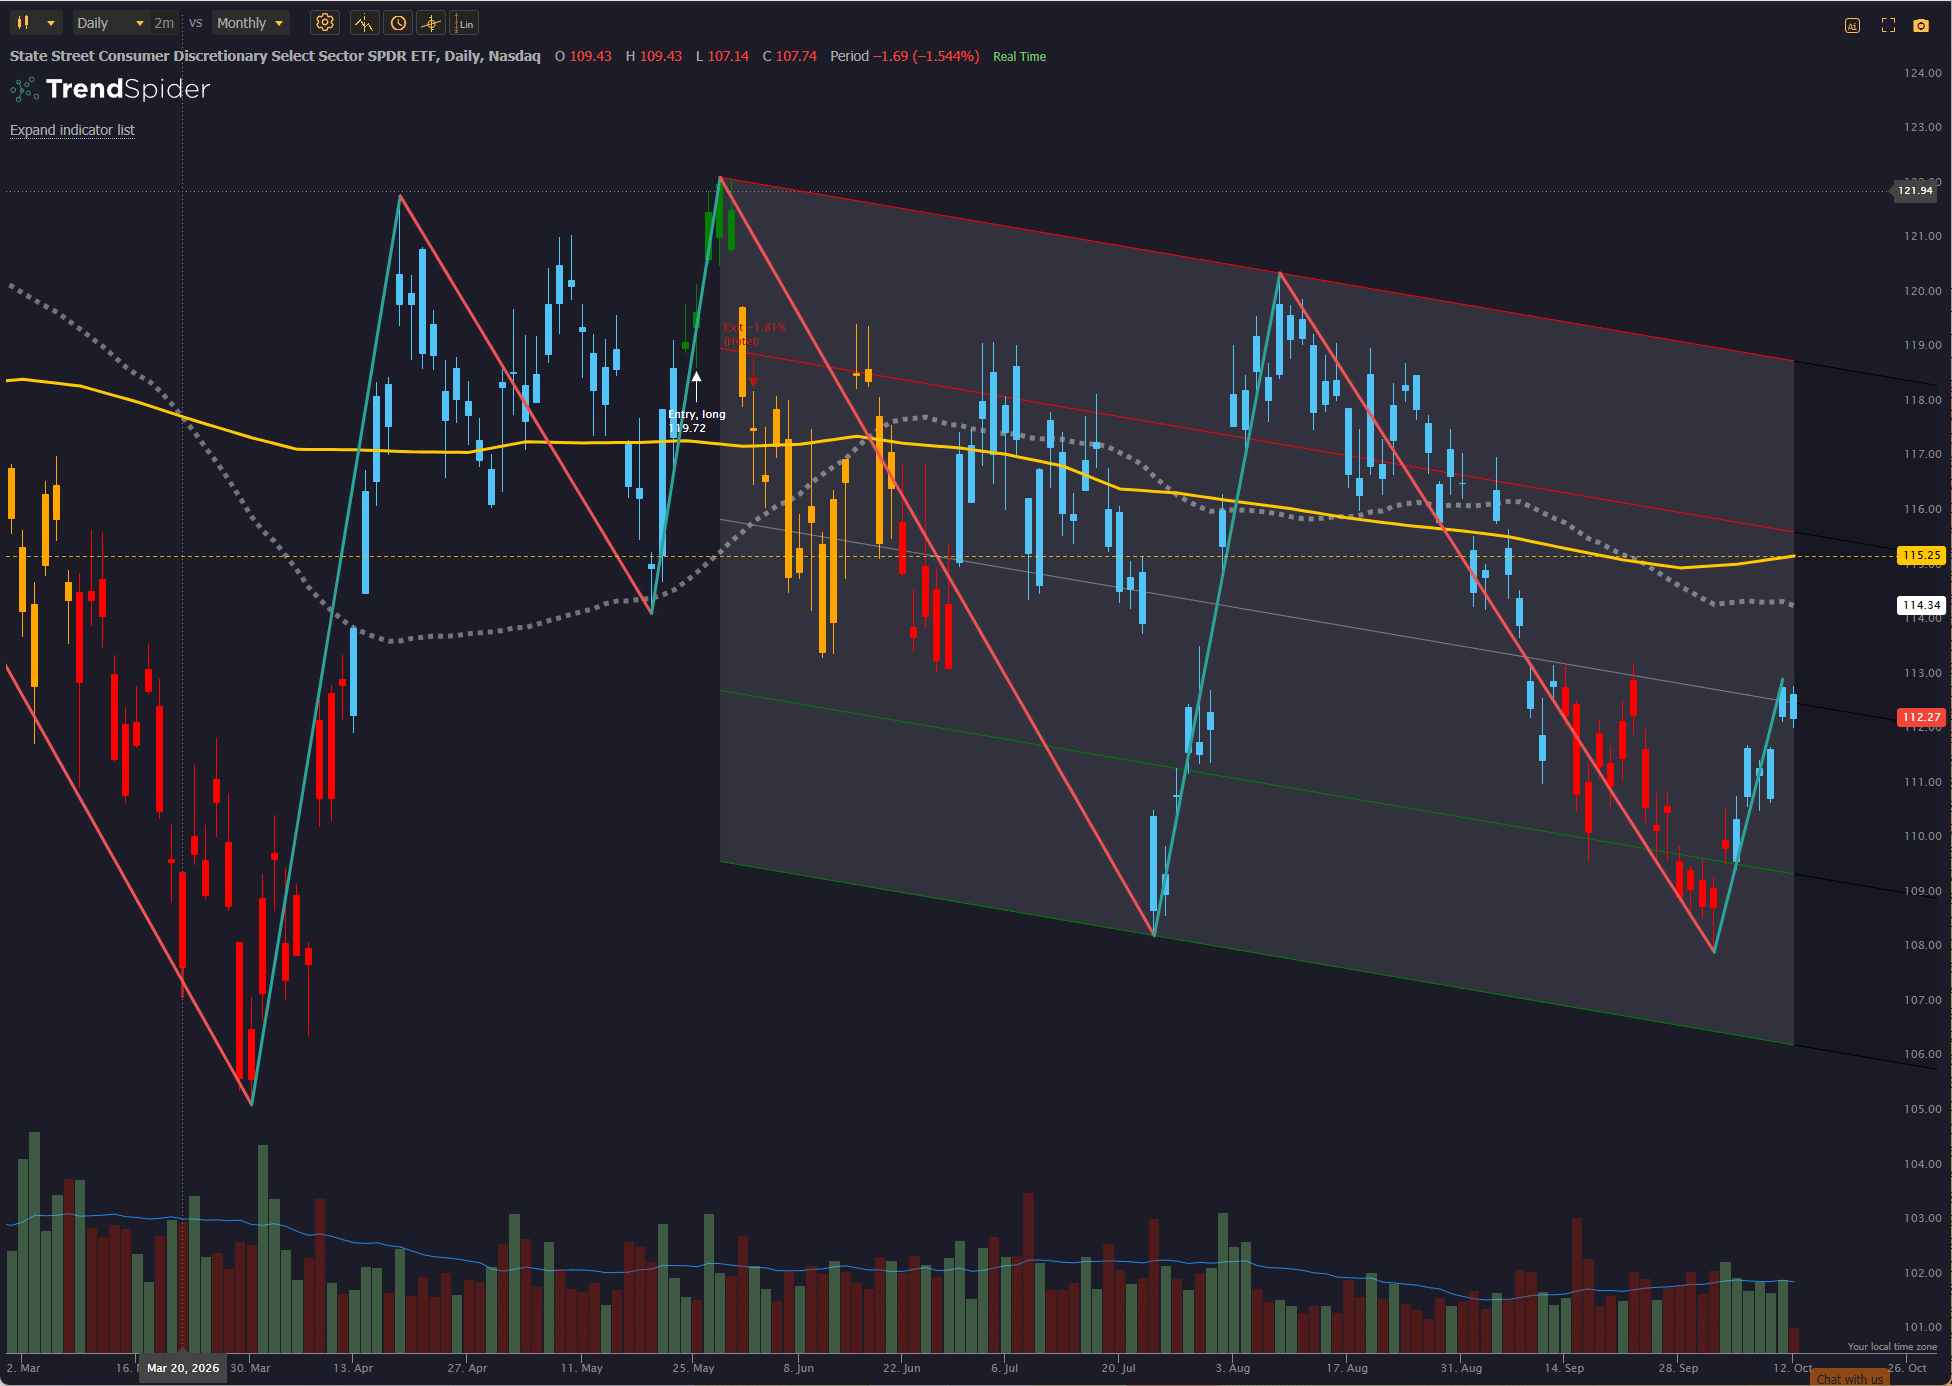 The patterns for XLP look very similar – so I have not added any of these recommended Mean Reversion (MR) Buy ETFs.
However, with Financials (XLF) leading off the earnings season in the 4th I did take a look at the price chart:
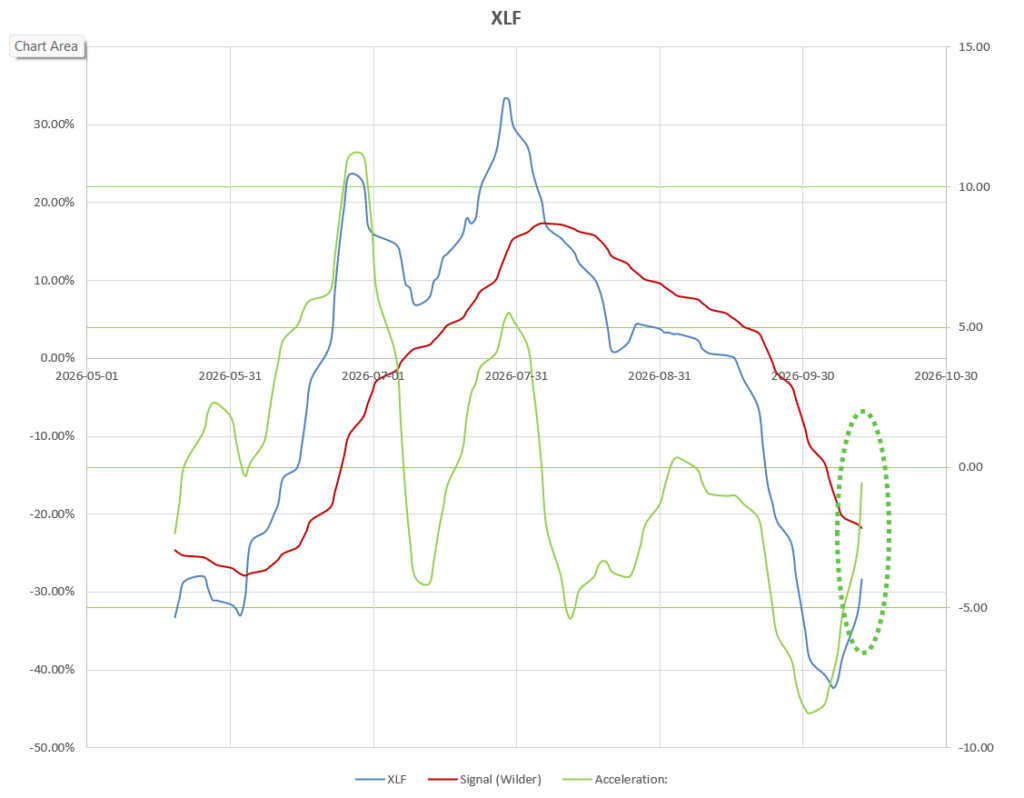
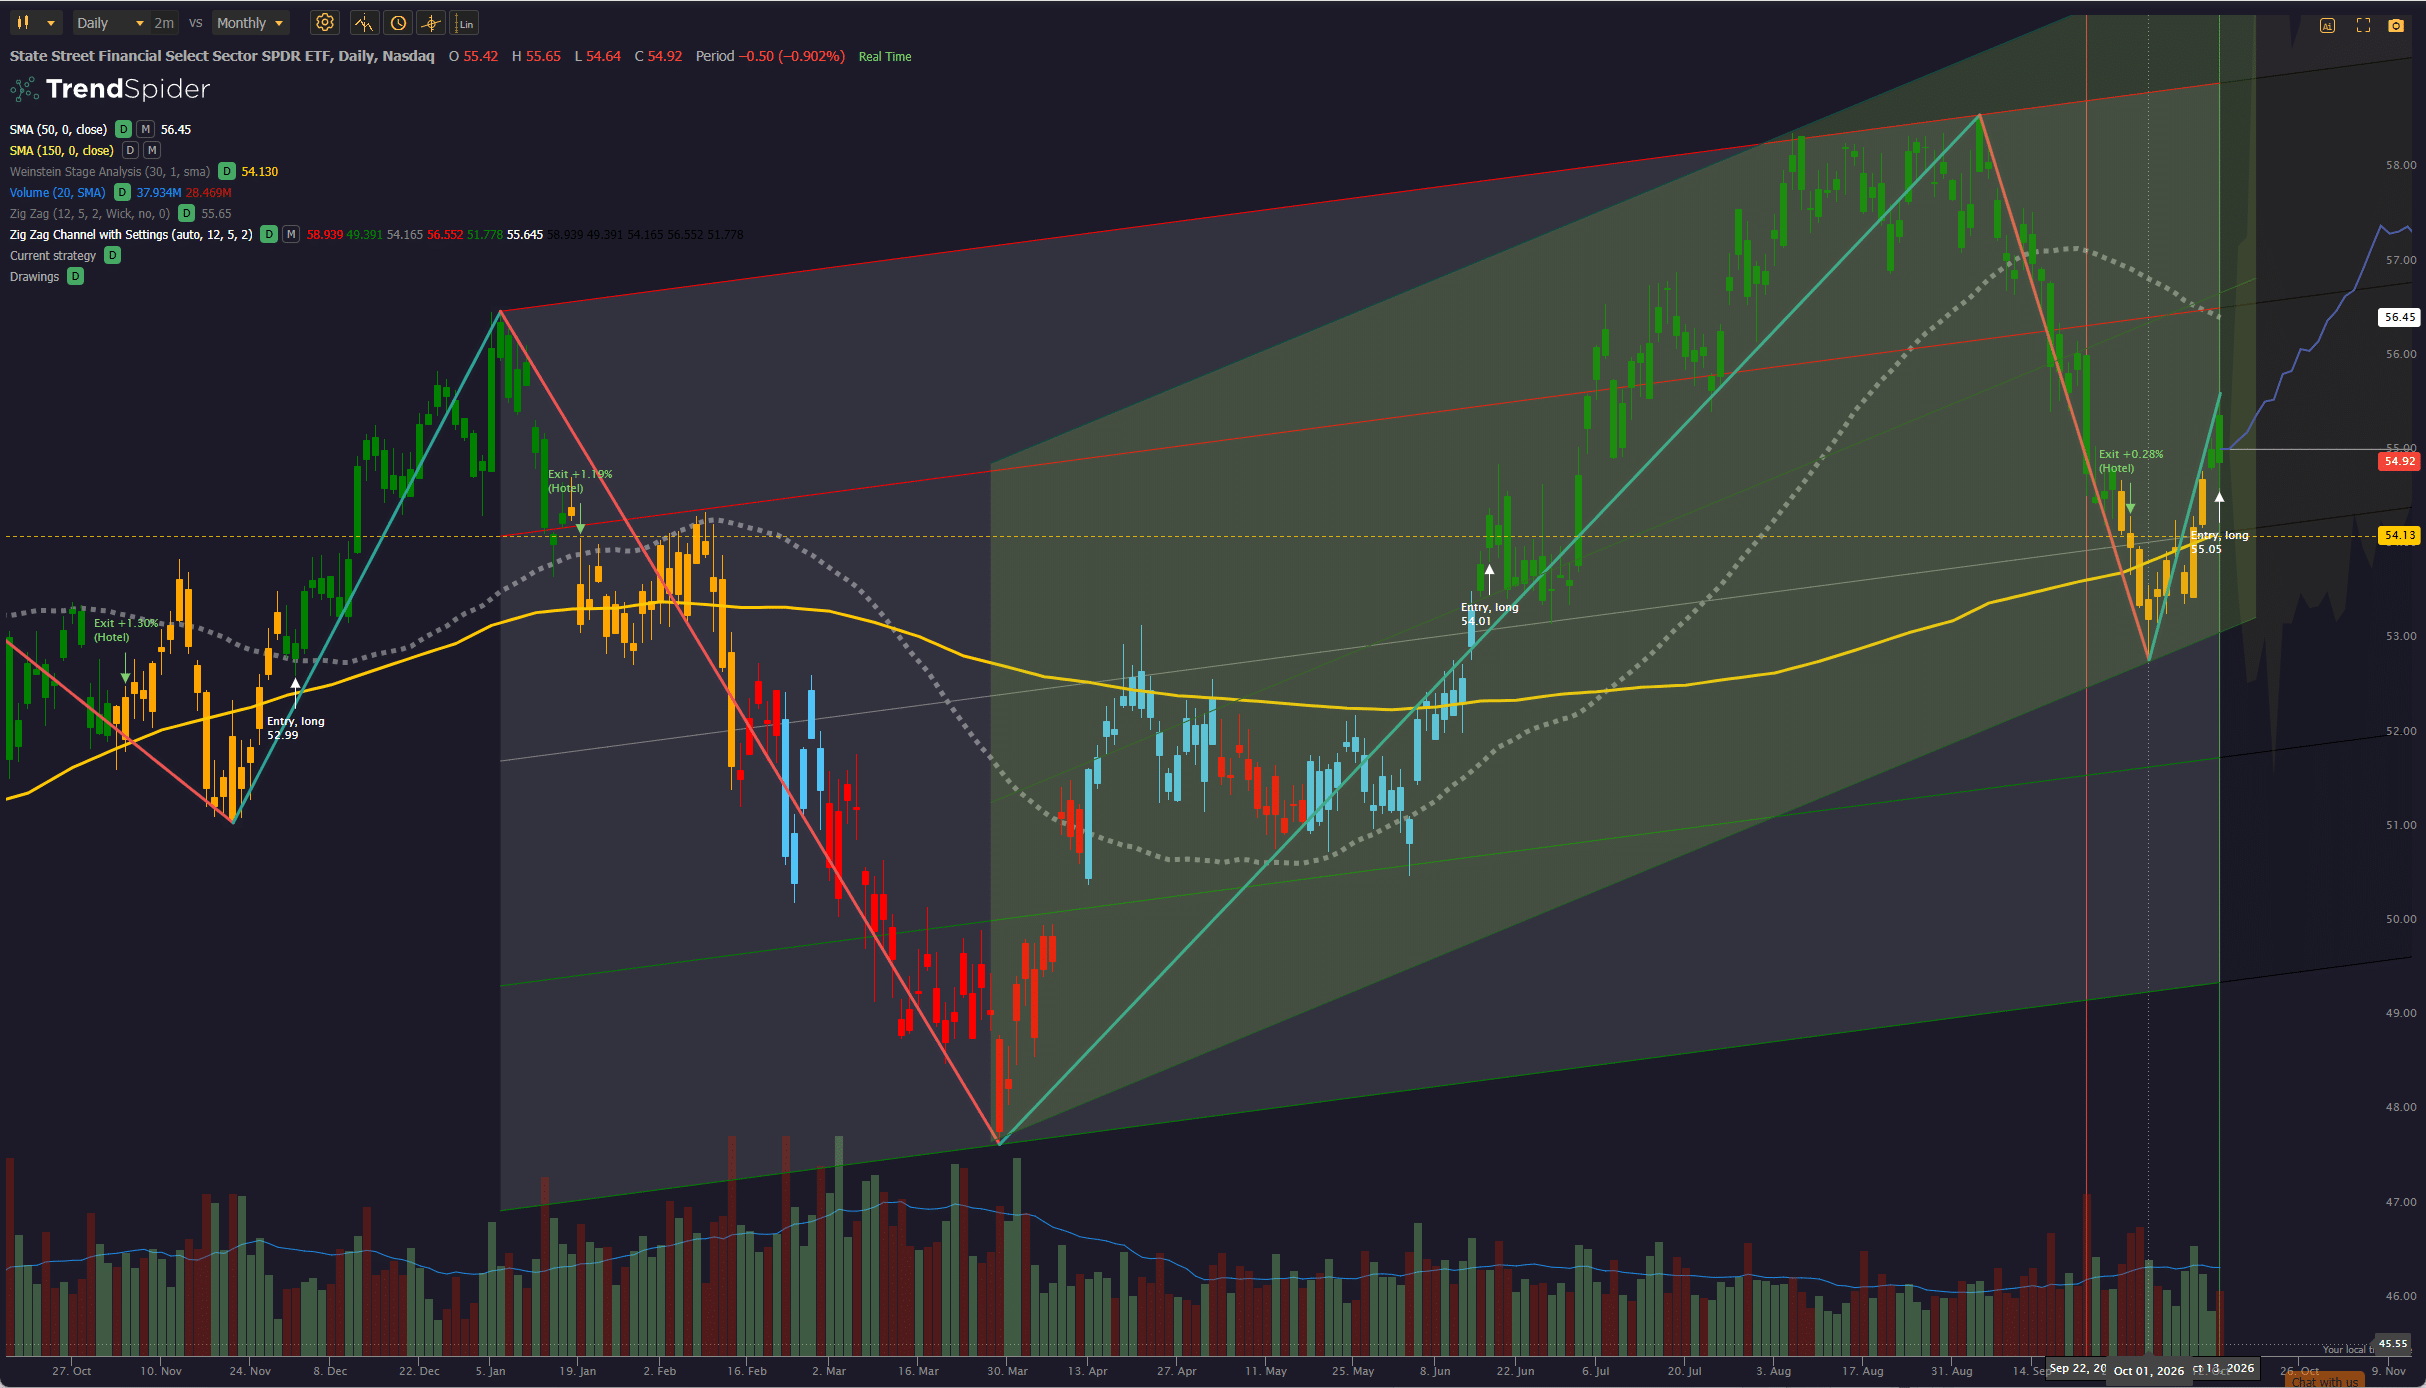 that is looking as though it might move out of the Weinstein Stage 3 range (yellow bars) – with a bounce off the lows of a bullish channel – and form a continuation pattern back into Stage 2 (green bars). I have therefore chosen to re-enter my position in XLF (that I closed on 9 September) – despite the fact that the momentum/acceleration graph is not yet supportive – but probably close within the next week.:
 Current performance looks like this:
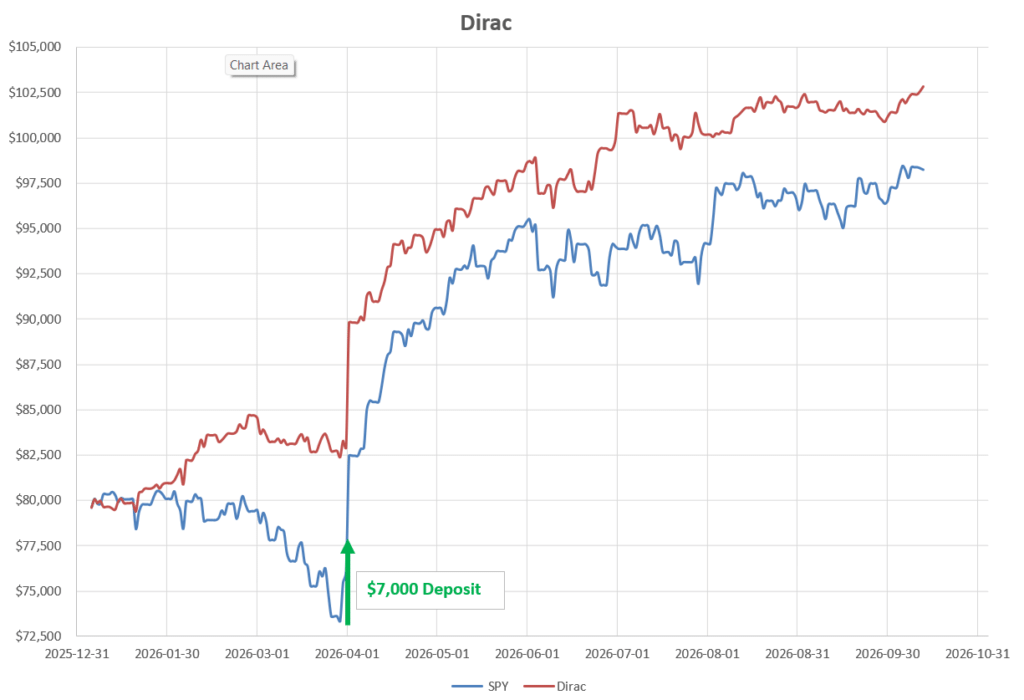 with ~33% held in “Cash” (BIL).
Discover more from ITA Wealth Management
Subscribe to get the latest posts sent to your email.
Leave a Comment or Question