
Amsterdam, The Netherlands
Based on recommended signals from the Dirac analysis sheet, used to manage this portfolio, trading activity in the last week looks like this (red box):
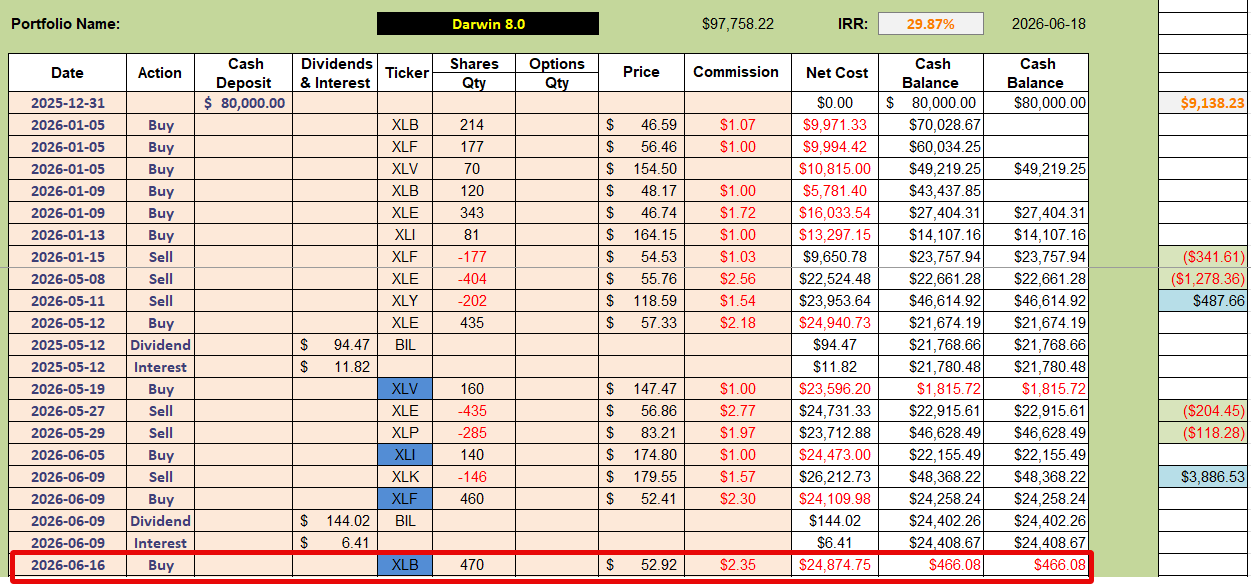 with the addition of XLB (Materials) being the only adjustment made to the portfolio.
The analysis sheet currently looks like this:
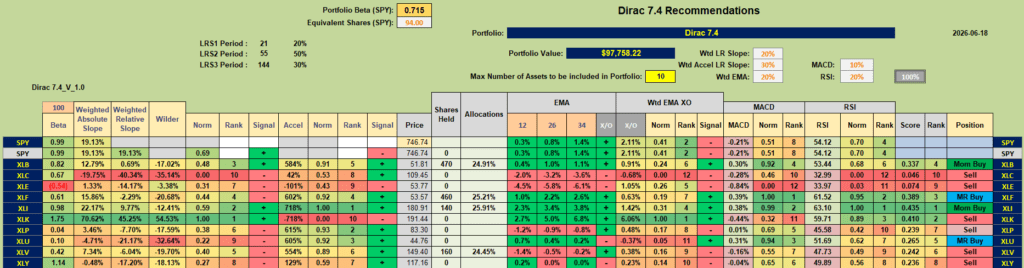 and I am holding all four ETFs that are suggesetd Buy candidates.
The momentum chart for XLB< that was added to the portfilio, looks like thia:
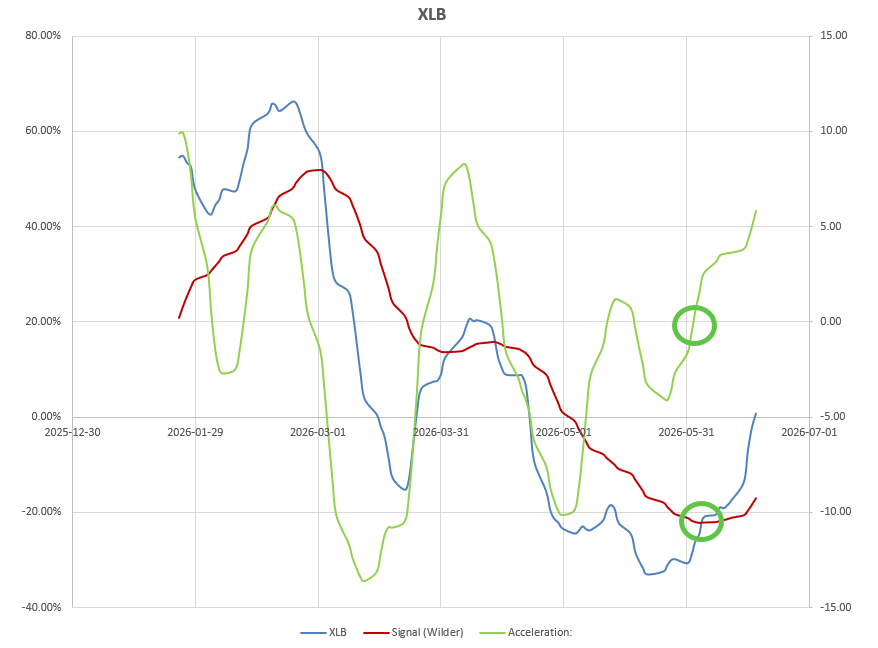 with nice clear, well defined, crosses of the key momentum and acceleration indicators supported by positive confirmatory signals from the short-term MACD and RSI indicators.
A Performance comparison of the sectors available within the investment quiver looks like this:
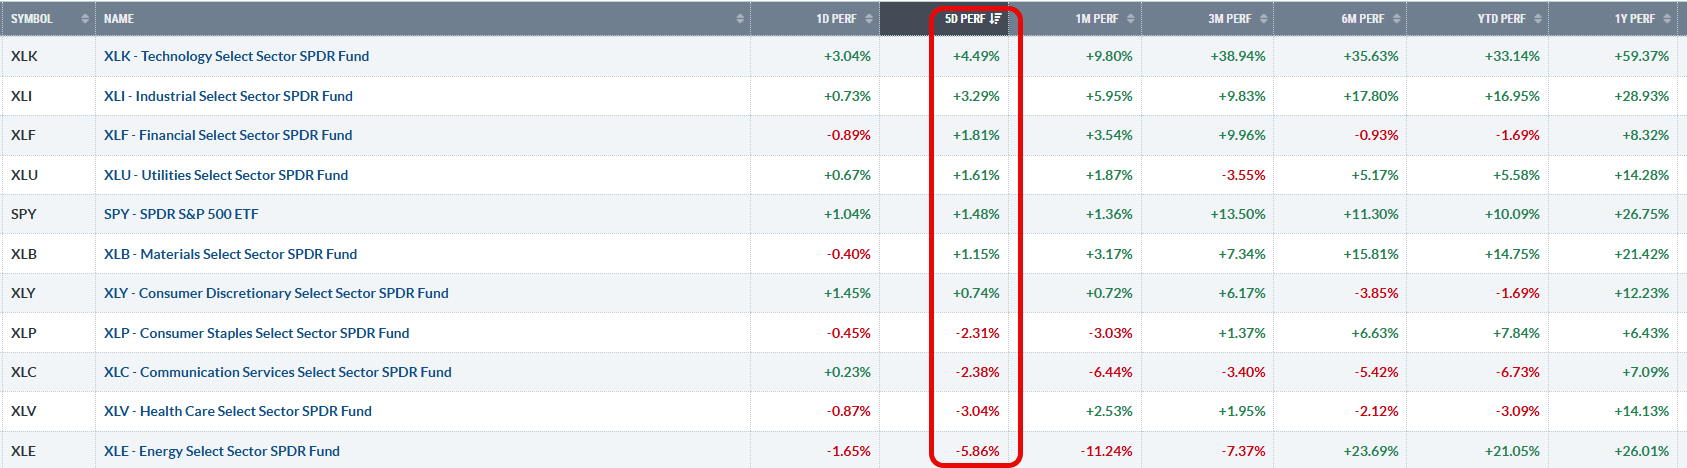 with XLK (Technology) continuing to lead the way.
I am presently not holding XLK in the portfolio, so let’s take a look at the momentum/acceleration graphs:
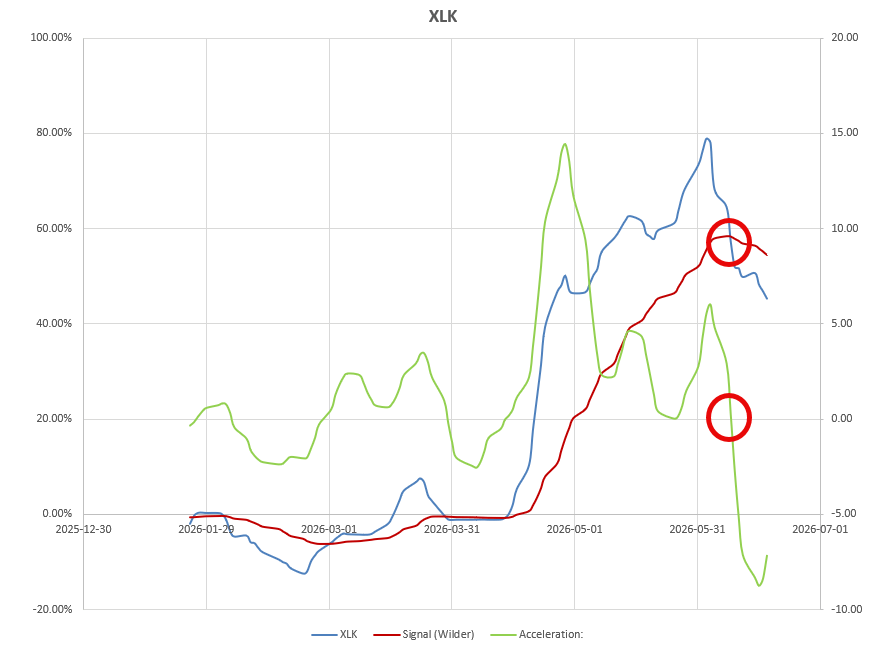 XLB is showing clear Sell signals in the above screenshot, despite the strong performance over the past week and a positive short-term RSI signal. This is normal “lag” seen in most “indicators” and should be corrected or confirmed in the coming days – meanwhile I will continue to monitor.
XLV did not perform well this past week (down 3%) so let’s take a look at the charts of this ETF:
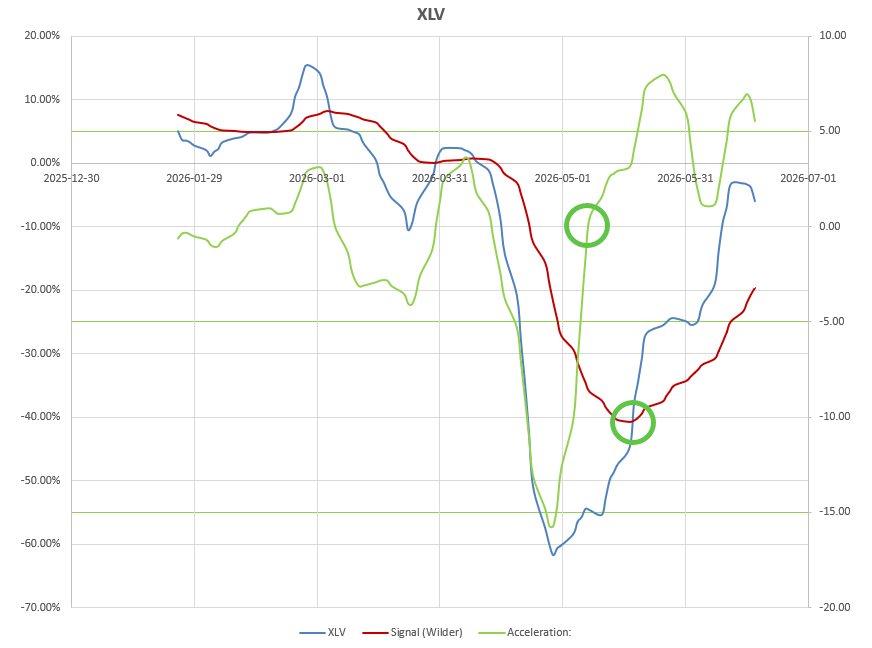
where we are still on Buy signals for both Momentum and Acceleration, although the lines are turning over into a dowward direction – so need to be monitored/watched from here. Performance over the past month has been good so we’ll wait and see whether this might just be a normal pullback in an uptrend channel:
 Performance of the Dirac Portfolio to date looks like this:
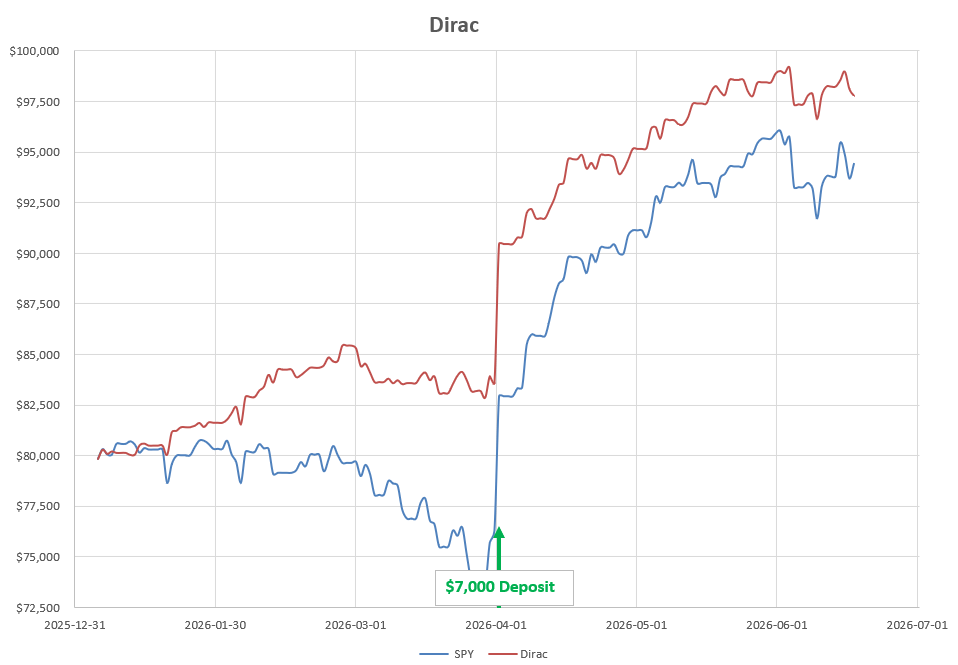 … still ahead of the broader market benchmark (SPY).
Discover more from ITA Wealth Management
Subscribe to get the latest posts sent to your email.
Leave a Comment or Question