
Illuminated Ferns at Vidanta World, Nuevo Vallarta, Mexico
The Dirac Portfolio is a US-only Equity Portfolio with no diversification outside of this market/asset class. The objective of the portfolio is to outperform the broader market, as represented by SPY (ETF tracking the S&P 500 Index), by rotating between sectors within this broader market.
This week saw a minor adjustment:
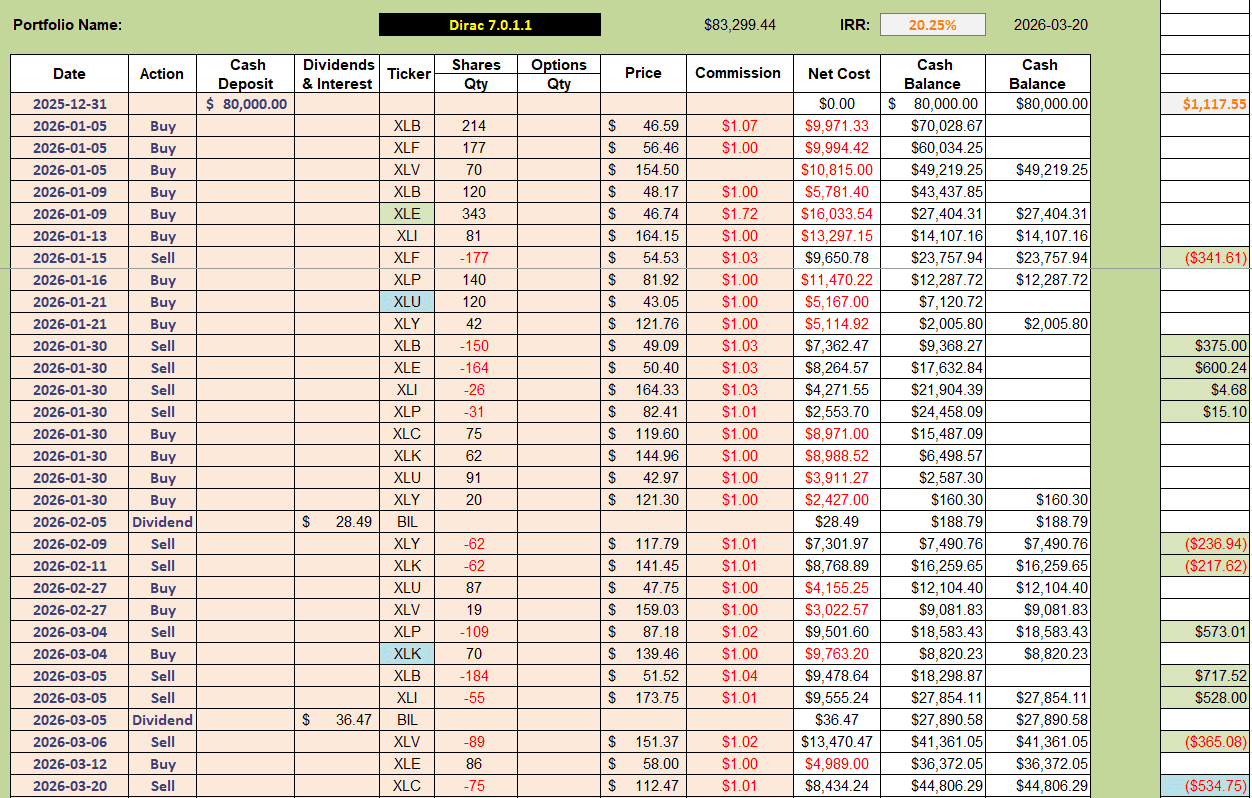 as I finally capitulated and sold out of my position in XLC (Communications) with a $535 loss. This is my 5th losing closed position versus 7 winners with average winning trade being greater than the average losing trade – that is what we want to see.
Looking at the graphs for XLC:
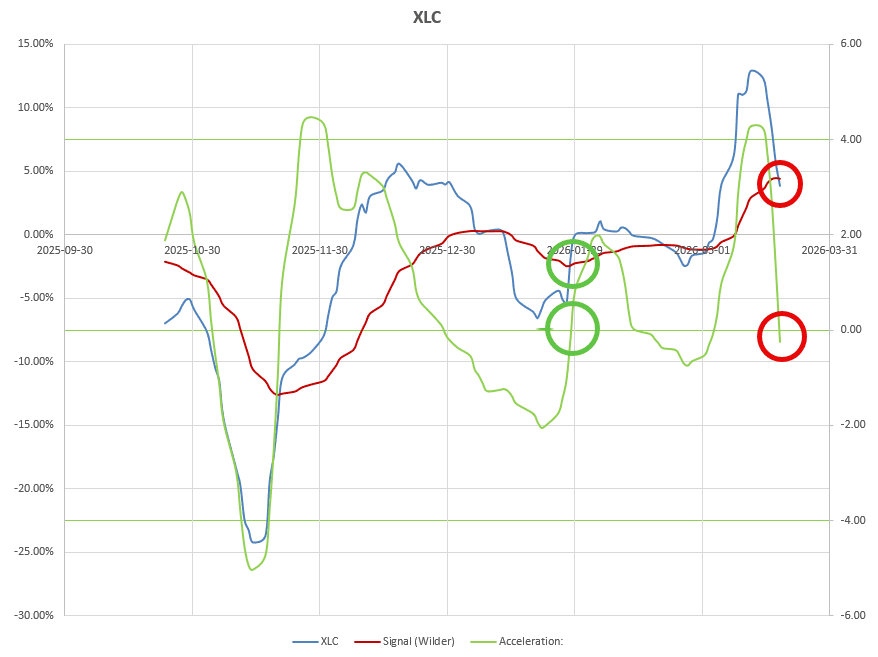 we see (green circles) where I entered a position based on a Mean Reversion Buy signal (positive acceleration and momentum trading above it’s Wilder moving average but with longer term momentum still lower that the benchmark – i.e. negative value for the blue line). I ignored the “noise” around the end of February when the signals recommended a Sell because day-to-day fluctuations were not generally negative. However, on Friday momentum and acceleration took a deep dive so I closed the position with a loss (red circles).
This means that my current holdings now look like this:
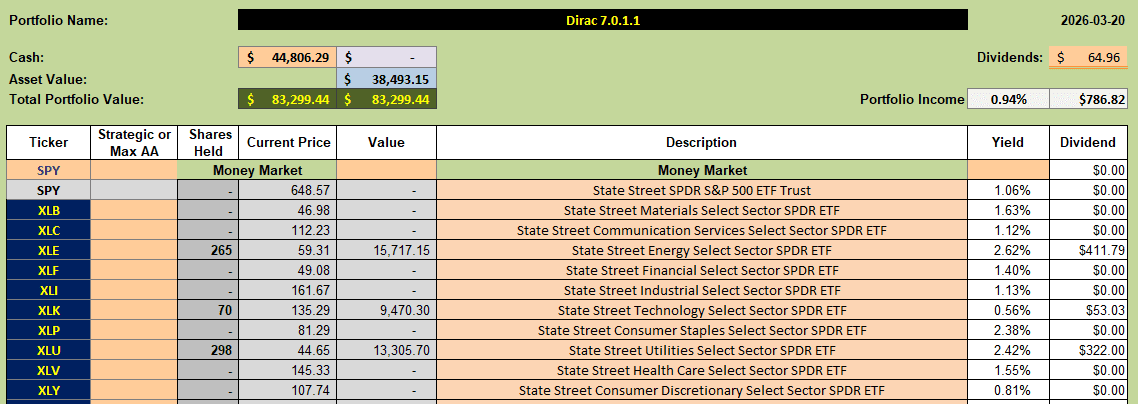 with positions in XLE (Energy), XLK (Technology) and XLU (Utilities) – although the positions are not quite equally weighted and do not constitute full investment with the portfolio currently only 50% invested.
Current analysis generates the following suggestions/recommendations:
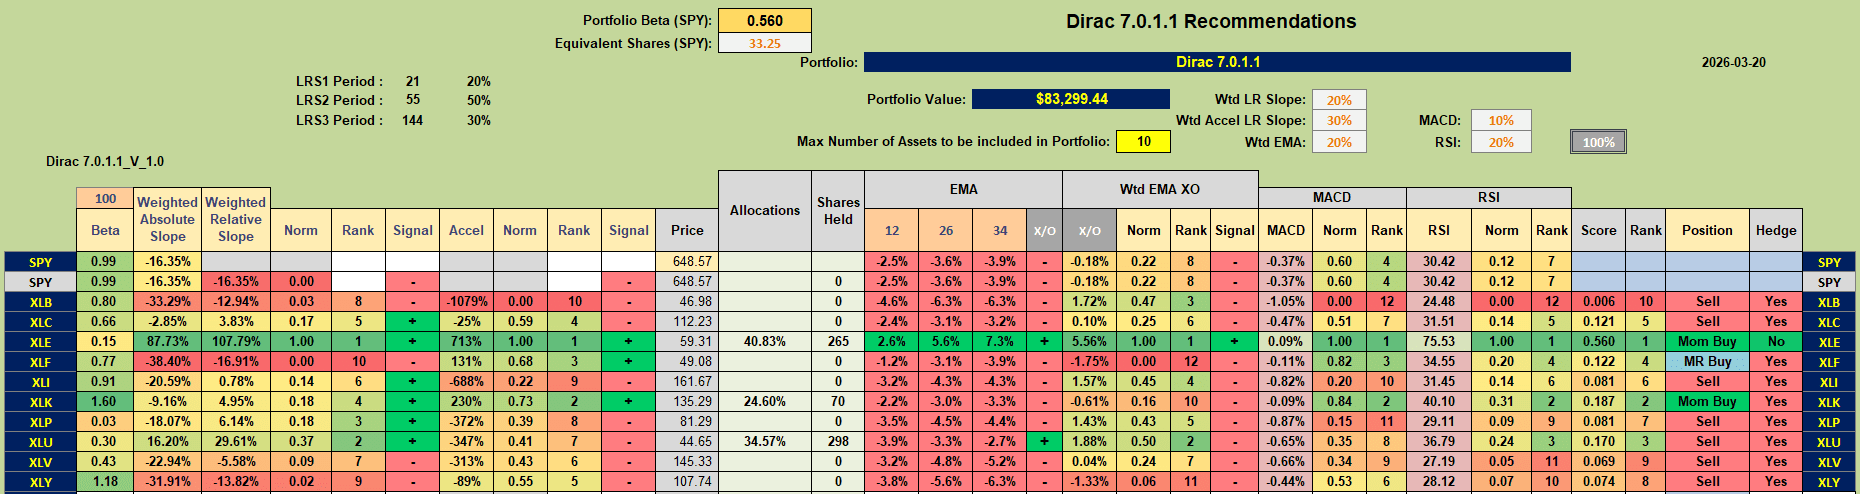
with Buy recommendations for XLE, XLF (Financials) and XLK with a Sell recommendation for XLU that is currently held.
So, let’s take a look at the graphs to help decide what adjustment we might make. First, the Sell recommendation for XLU (Utilities):
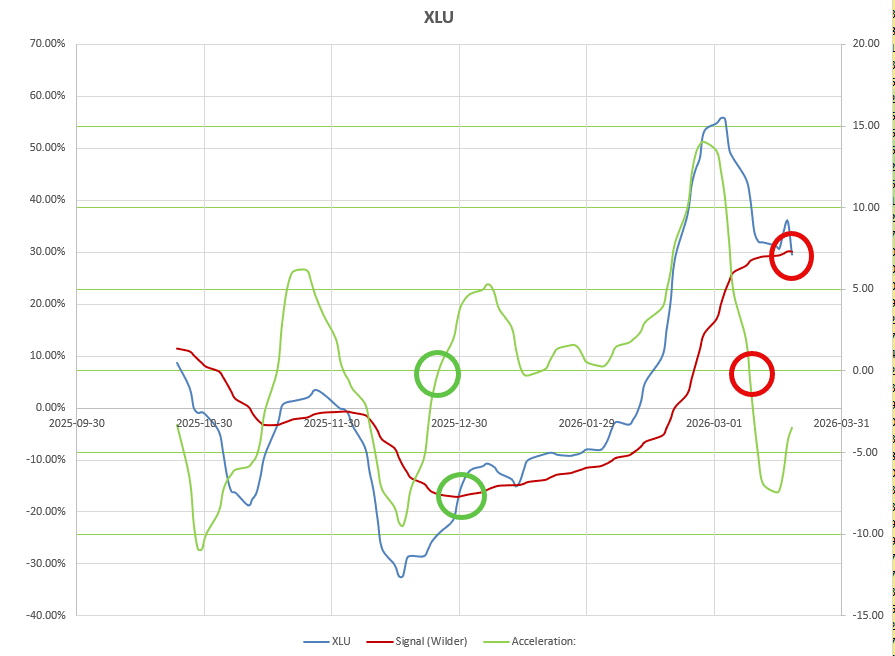 We opened this position in January with adjustments/additions to the position through January and February until we saw an initial warning signal a few days ago as acceleration (green line) turned negative. At that time, momentum (blue line) was positive relative to the benchmark (SPY) and still trading above it’s Wilder moving average (brown line). However, on Friday, momentum crossed below it’s average to confirm a sell signal. If XLU trades below it’s previous day’s low next week I will be closing this position.
XLF (Financials) is now suggesting a possible Mean Reversion Buy position:
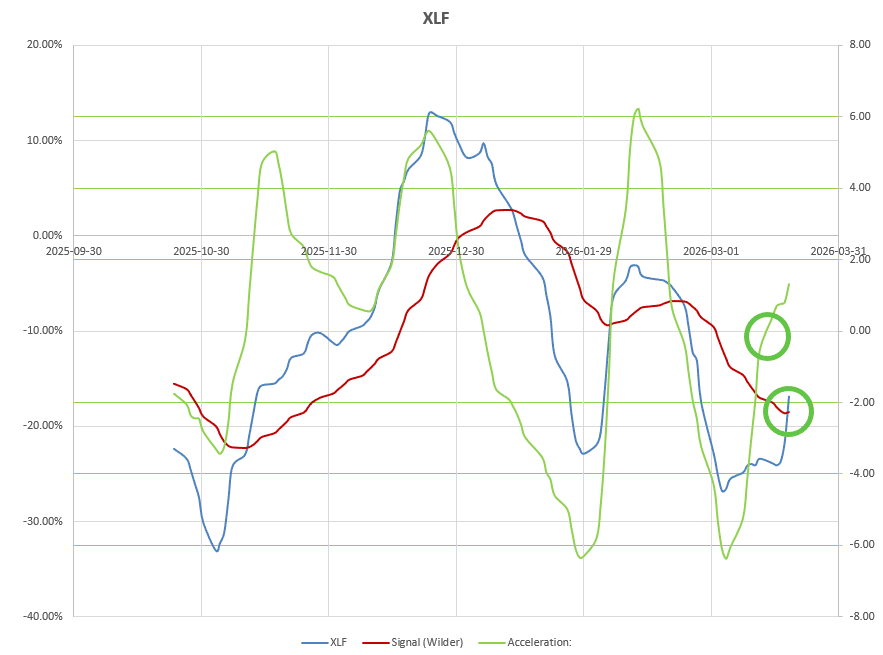 with the initial acceleration signal generated a few days ago being confirmed by longer term momentum (still below the relative strength of the benchmark) crossing above it’s Wilder moving average on Friday. If this positive trend continues next week as suggested by prices moving above the previous day’s high I will likely open a new position in this ETF.
For the sake of completeness let’s just check on our other current holdings:
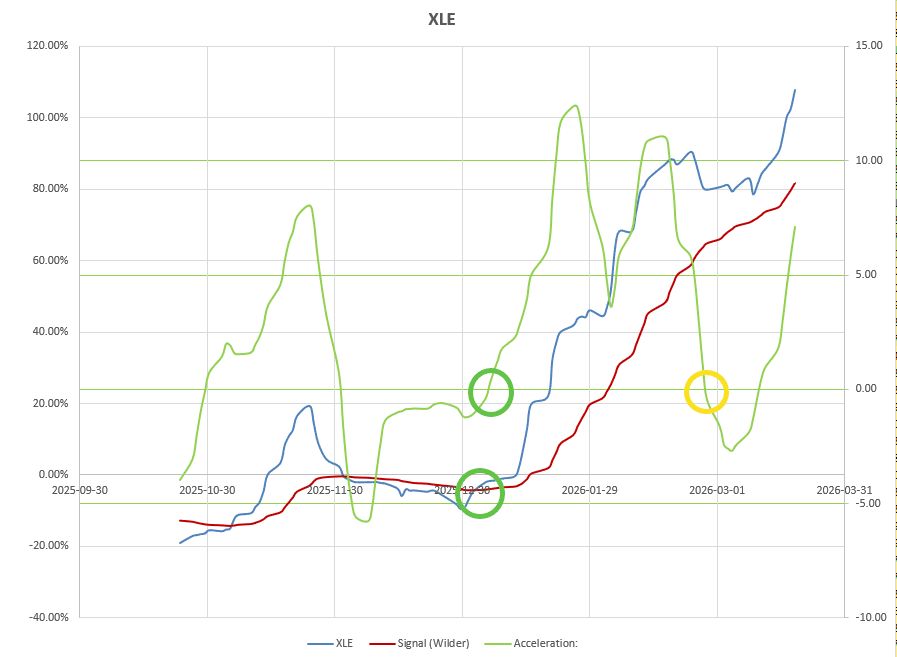 XLE (Energy) continues to show the most relative strength and, despite a recent pullback that generated a negative acceleration warning, this was not confirmed by a drop in momentum below it’s Wilder moving average and has since returned into positive acceleration territory. This is a good example of why I introduced the Wilder average confirmation filter as my original algorithm would have generated a Sell signal in late February (yellow circle).
XLK (Technology) is the other current holding:
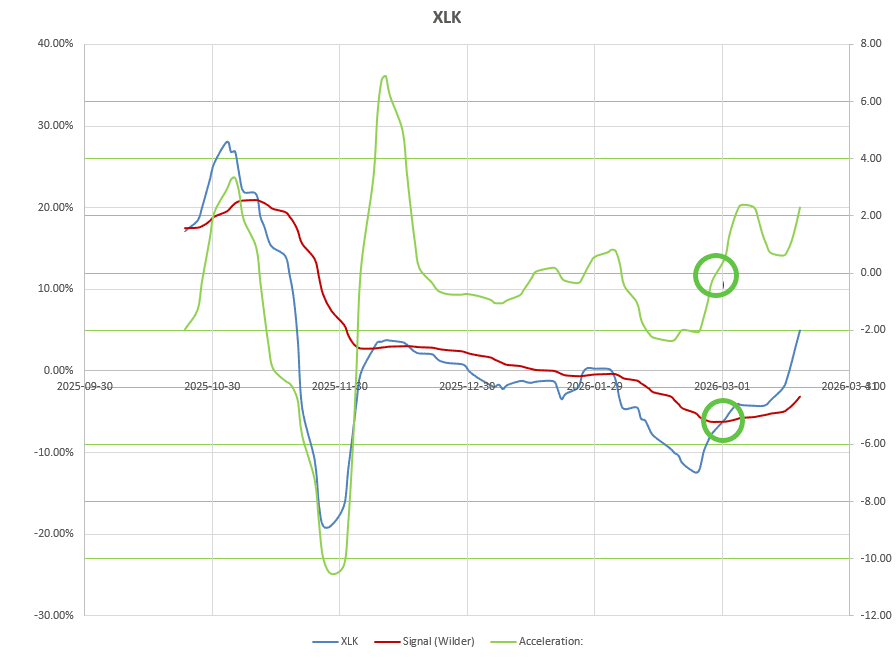 with this being a Mean Reversion Buy signal generated at the beginning of the month.
Recommended allocations (assuming investment in only 3 ETFs) look like this:
 Assuming that I will end up holding only 3 ETFs in the portfolio (XLE, XLK and XLF) I would close out the existing position in XLU, open a new position in XLF and add shares to existing positions in XLE and XLK as shown above so as to meet my goal of being fully invested. However, these are nervous times and, with US equities currently in a (short-term) downtrend, I may tread softly here and leave a little cash in hand for future adjustments. Holding 4 assets would mean a ~$20,000 investment in each – so I may hold back this $20,000 and distribute the other ~$60,000 to the 3 ETFs – i.e. $20,000 each.
Performance of the Dirac Portfolio to date looks like this:
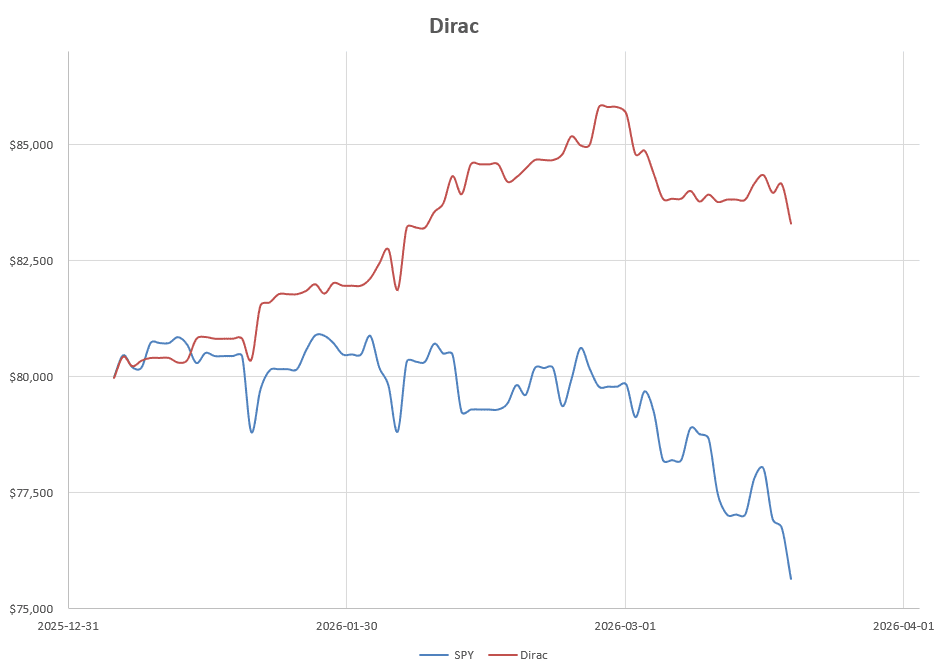 which, despite Friday’s weakness, is holding up very well compared to the ~5% loss in the broader market (SPY).
Of course, as a reminder, although not officially a part of this portfolio, I still have my Portfolio Hedge, using Options, that looks like this:
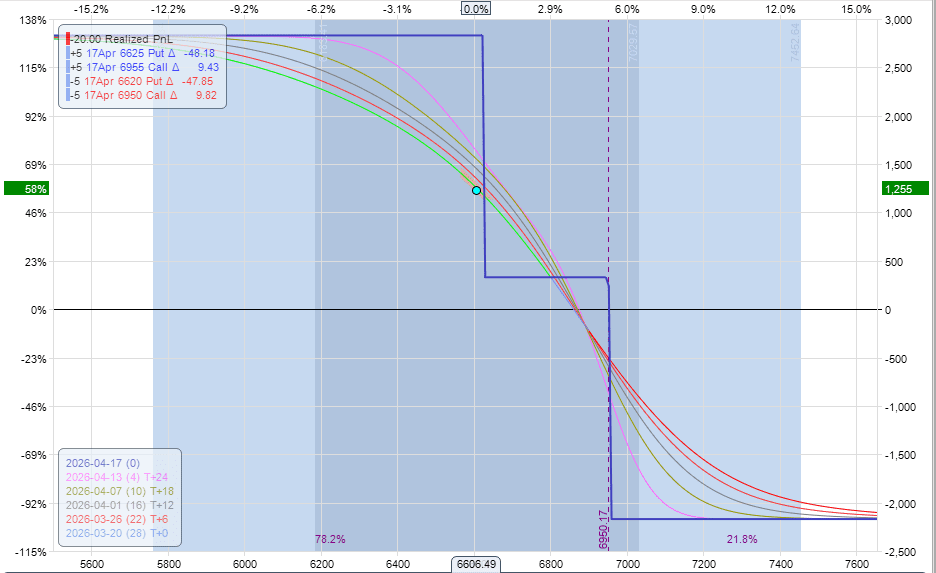 and is currently showing an unrecognized profit of ~$1,250.
Discover more from ITA Wealth Management
Subscribe to get the latest posts sent to your email.
Today, I sold out of my position in XLU, added a new position in XLF and added to my existing position in XLE. I am presently ~60% invested.
Today I added 75 more shares of XLK (Technology) to balance my holdings with 75% portfolio value invested.