
Wild Flowers, Bali, Indonesia
It is a difficult time to be managing the Dirac Portfolio using a momentum model since we are not, currently, in a strong trending environment and we have little diversification to separate the assets in our quiver – all of which reside in the US Equity asset class. Money is clearly moving around within this asset class, but the movement is not classical or clear and tends to change from day to day rather than month to month as we would prefer.
Checking the current analysis sheet we see the following picture:
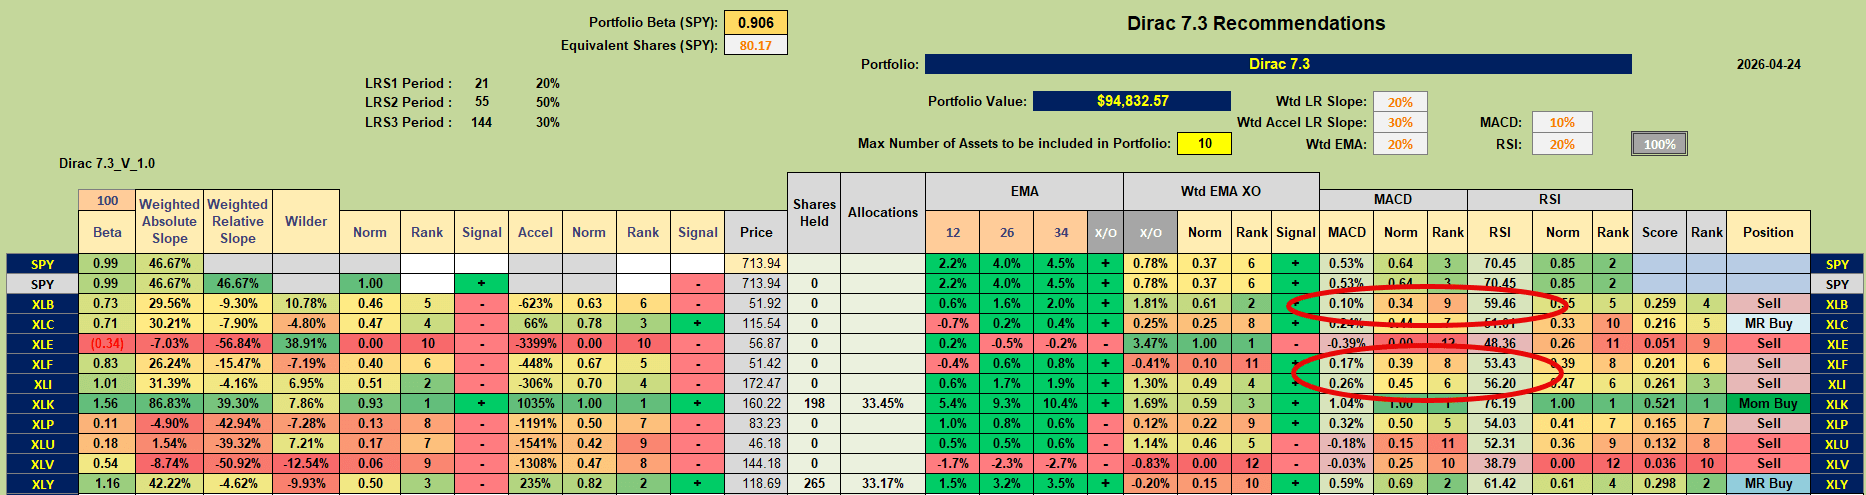 with only 3 Buy recommendations but strength in the short-term indicators.
I have recently expanded the algorithm used to manage momentum/acceleration portfolios and details were provided in my recent review of the Darwin Portfolio. However, I will repeat the information here so that readers do not have to go searching for it.
Up to this point (the first 4 months of using this system) I have classified assets as potential Momentum Buy, Mean Reversion Buy, Hold or Sell candidates based on the signs of momentum and acceleration (rate-of-change of momentum) as shown in columns eight (8) and twelve (12) from the left in the above screenshot. I have then made “discretionary” adjustment decisions based on my observations of price action in shorter time frames by looking at:
- Whether momentum has crossed above or below it’s 12-period Wilder Moving Average;
- Whether the Moving Average Convergence-Divergence (MACD) Indicator is positive or negative;
- Whether the Relative Strength Index (RSI) is greater or less than 50.
I have now adjusted my algorithm to reflect more (maybe) precise rules/guidelines for making adjustment decisions. I have retained the same recommendation classifications but have built rules that include the above three signals to color code the recommendations shown in the second (2nd) column from the right. There are potentially:
- three (3) shades of green for Momentum Buy recommendations:
- three (3) shades of blue for Mean Reversion Buy recommendations:
- two (2) shades of yellow for Hold recommendations, and
- two (2) shades of red for Sell recommendations.
The stronger the shade of color, the stronger is the recommendation. In the above screenshot we see XLC with a very pale blue Mean Reversal Buy recommendation – but this is certainly not a very encouraging recommendation at this point – but maybe worth watching going forward.
Going into the past week I was holding five (5) sector ETFs in the portfolio – XLB (Materials), XLF (Financials), XLI (Industrials), XLK (Technology) and XLY (Consumer Discretionary) even though three of these (XLB, XLF and XLI) were signaling Sell recommendations. As I mentioned in last week’s review of this portfolio, I had made a discretionary decision not to sell these ETFs since the shorter term indicators (MACD and RSI) were all generating positive signals, the price charts were not suggesting an immediate collapse, and I did not want to sell prematurely.
In the above screenshot we see that the algorithm is still generating Sell signals for these three ETFs but that the background is now a mid-tone red color rather than the deeper red color of the Sell signals for XLE, XLU and XLV. This reflects the fact that the longer term momentum trends are not strongly supported by the shorter term indicators and that, while we would like to keep things simple and act on go-nogo signals, it may be more prudent to look for confirmations before taking action.
Let’s take a look at the momentum/acceleration graphs for the three ETFs that we were holding that have a Sell recommendation with a mid-tone red background:
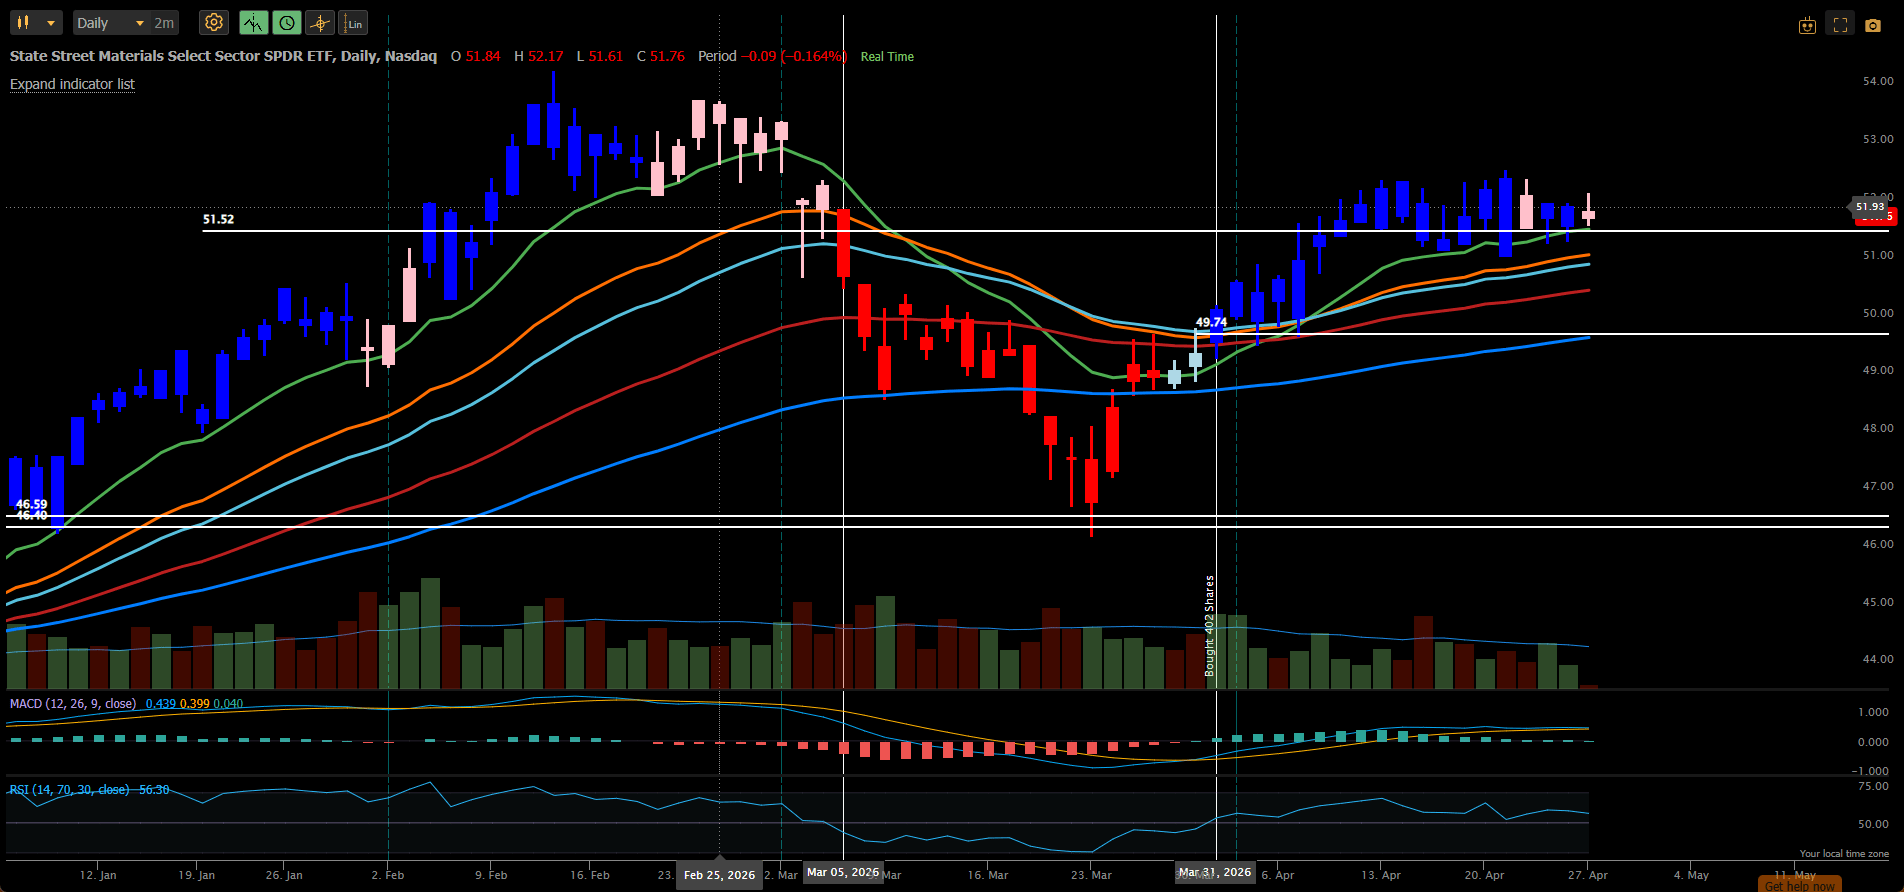
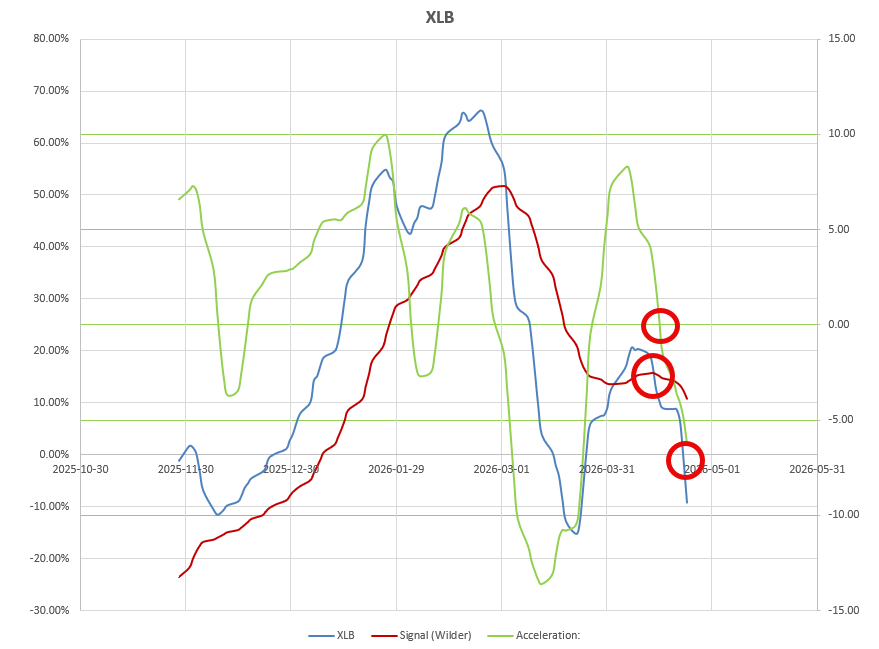 the change here, from last week’s graph, is that momentum has now turned negative and we now have three negative signals – even though not backed up by shorter term negative MACD and RSI signals. This remains a discretionary decision at this point, but I decided to Sell and to lock in profits with both momentum and acceleration pointing strongly downward.
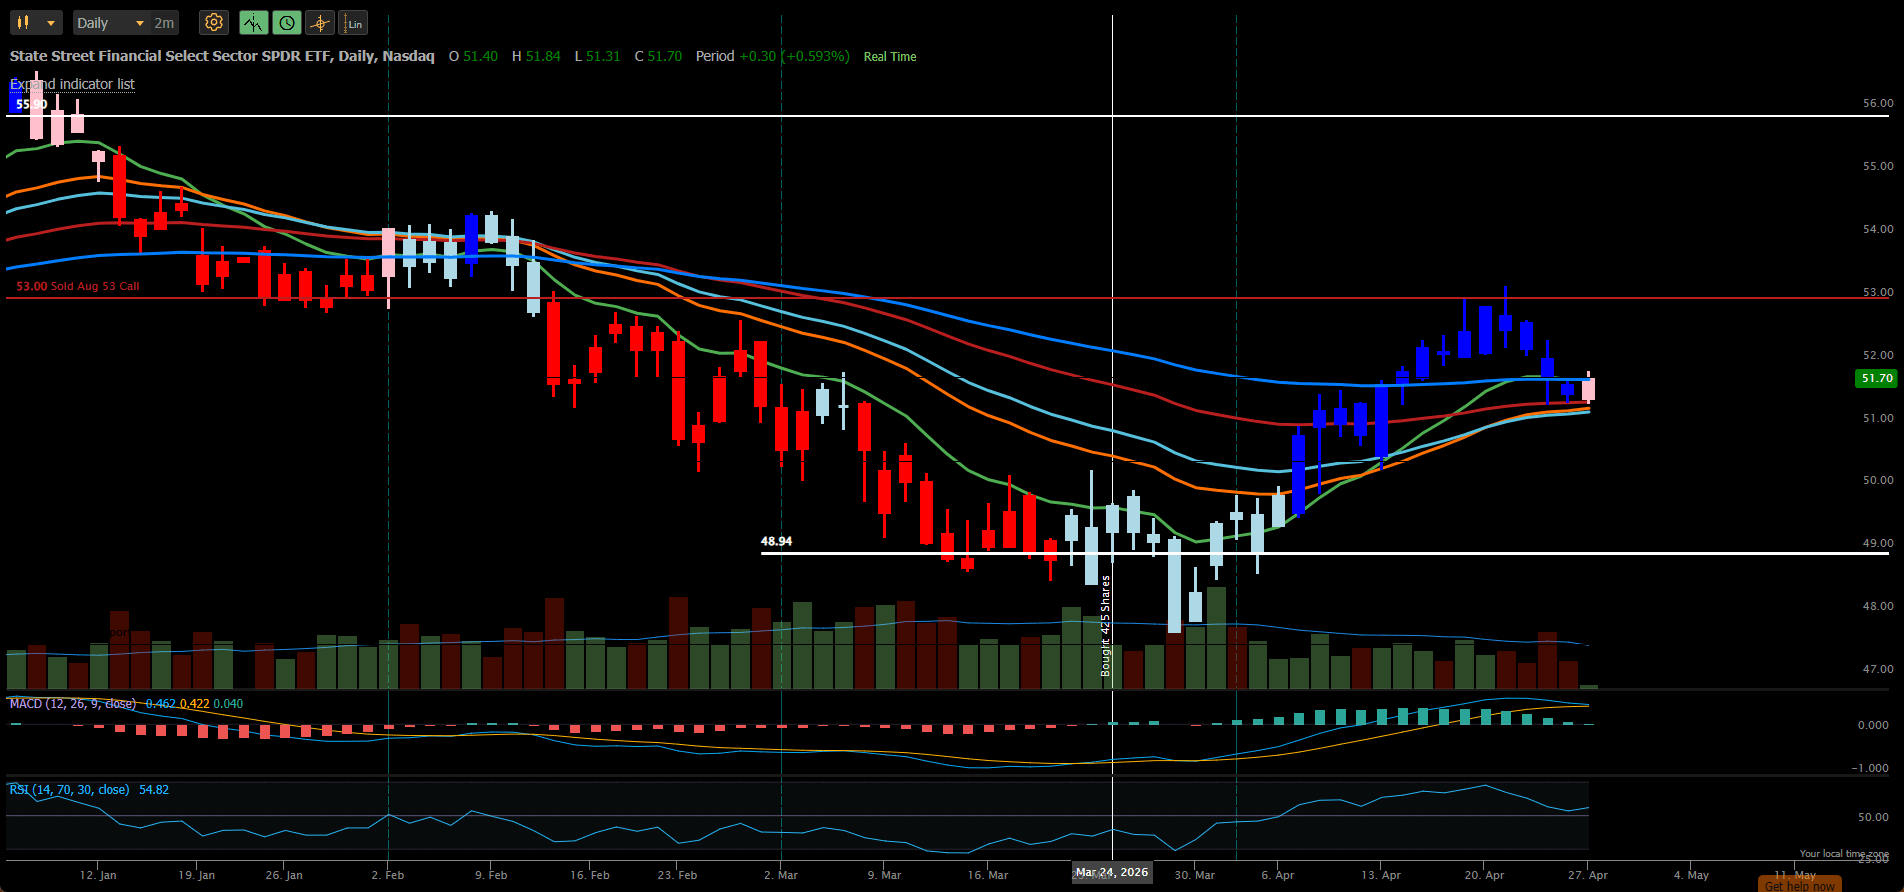
 The second ETF is XLF (Financials)
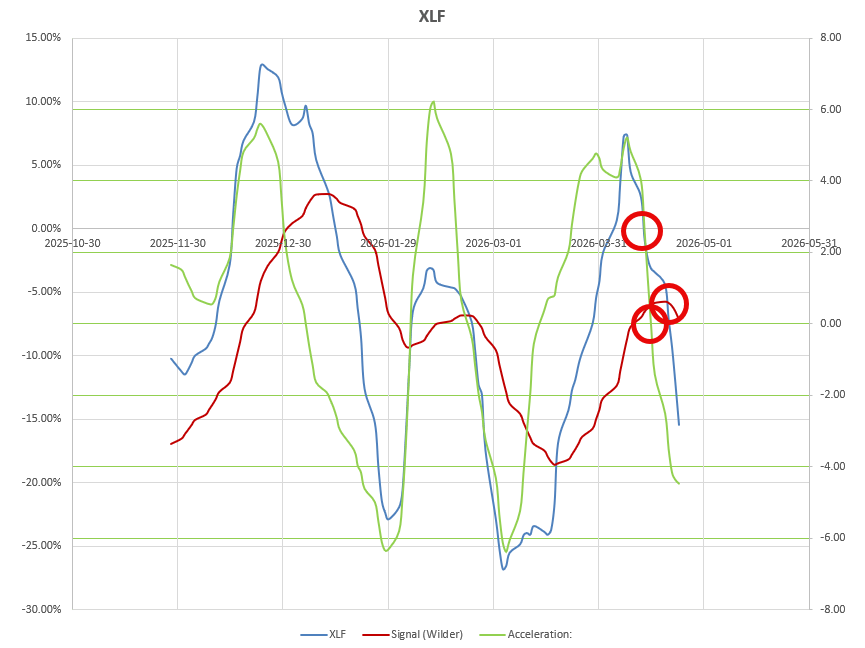 that shows a similar change from last week with momentum recently crossing below it’s Wilder Moving Average. Again, this negativity is currently not confirmed by the short-term indicators, but I still chose to Sell based on the strong down slopes of longer term momentum and acceleration. It also locked in a nice profit over the past month.
 Finally, XLI:
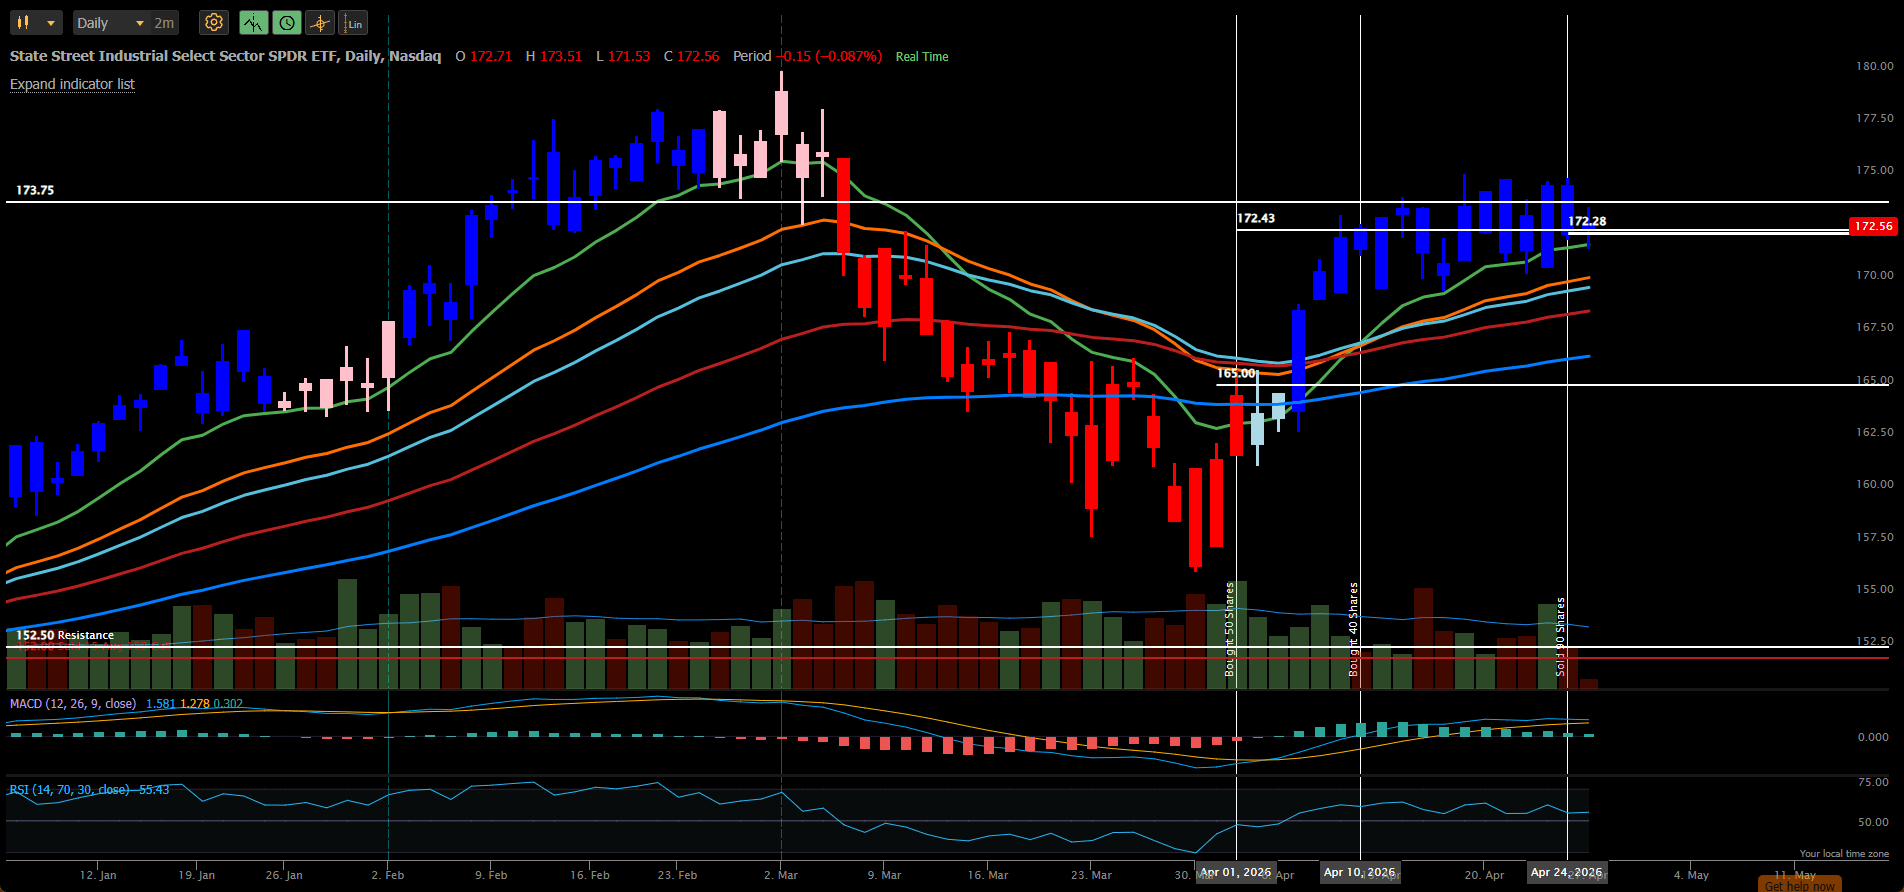
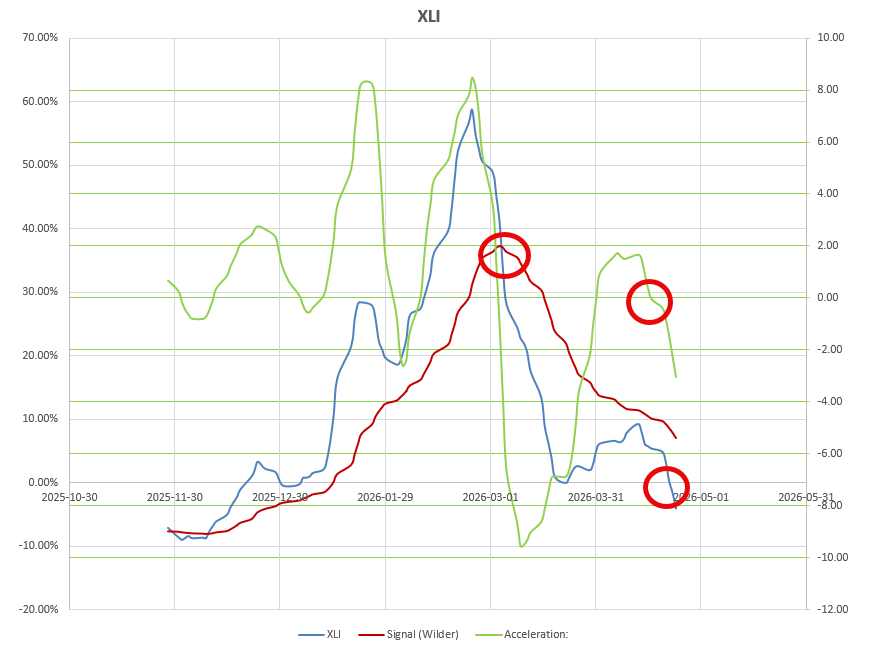 looks slightly different but has added a negative crossing of momentum – so, again I chose to Sell with three negative signals on the graph and the chart in consolidation mode:
 Trades this week therefore look like this (red box):
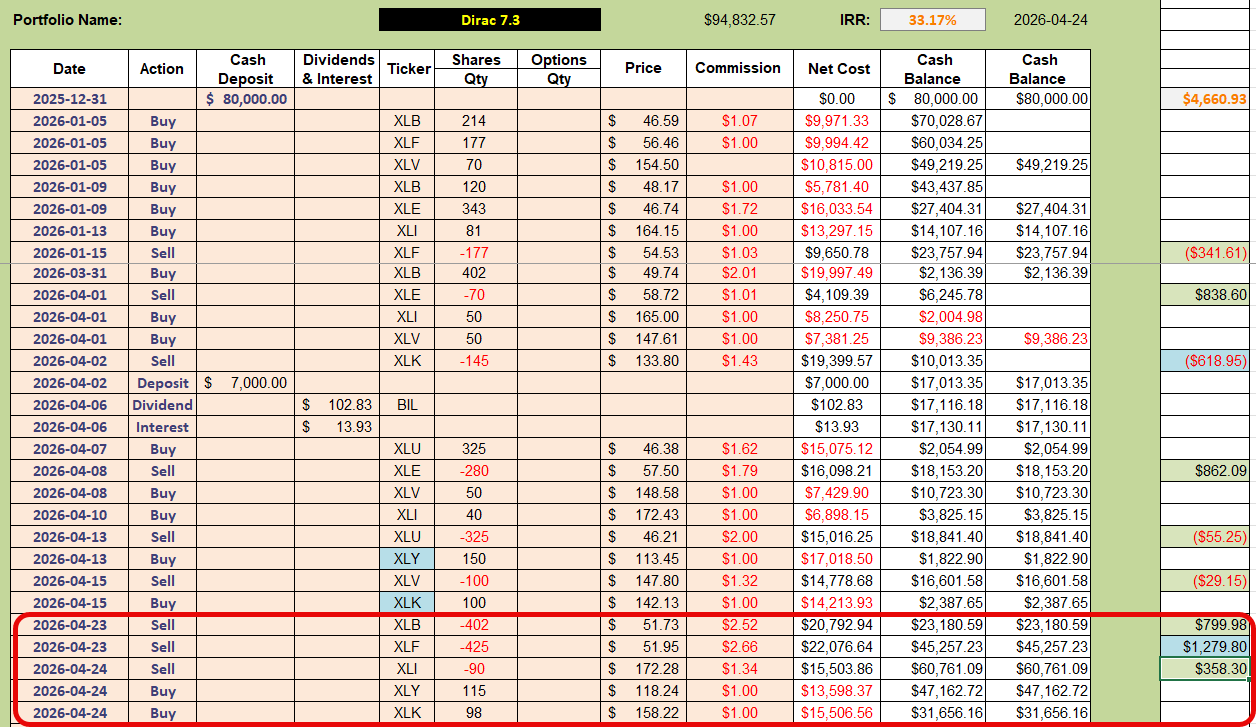 with ~$2,400 of locked in Profit. Note also, that since I would like to be 100% invested with ~equal allocations to ETFs held in the portfolio, I used some of the funds generated from the sale of the 3 ETFs to add shares to existing positions in XLK and XLY. Since I am only holding two ETFs in the portfolio and anticipate adding at least one more to the portfolio in the near future I have kept ~$30,000 in Cash (BIL) to allow for this/these purchases without having too much churn in trade activity without a signal/recommendation change.
Performance of the portfolio to date looks like this:
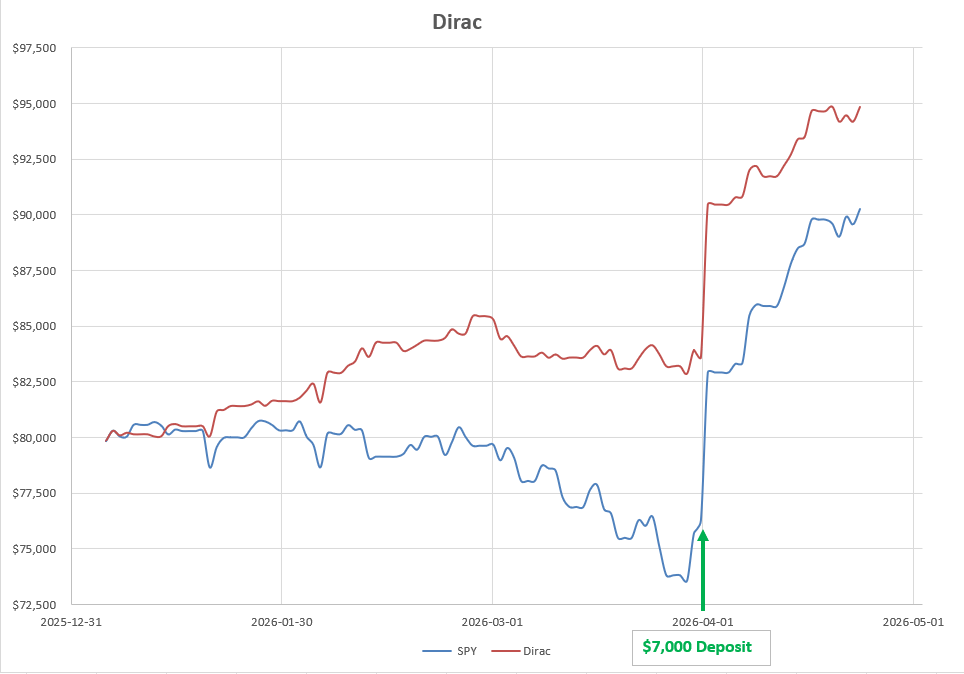 still ~6% ahead of the benchmark after ~4 months.
Discover more from ITA Wealth Management
Subscribe to get the latest posts sent to your email.
Leave a Comment or Question