
Mammoth Hot Springs
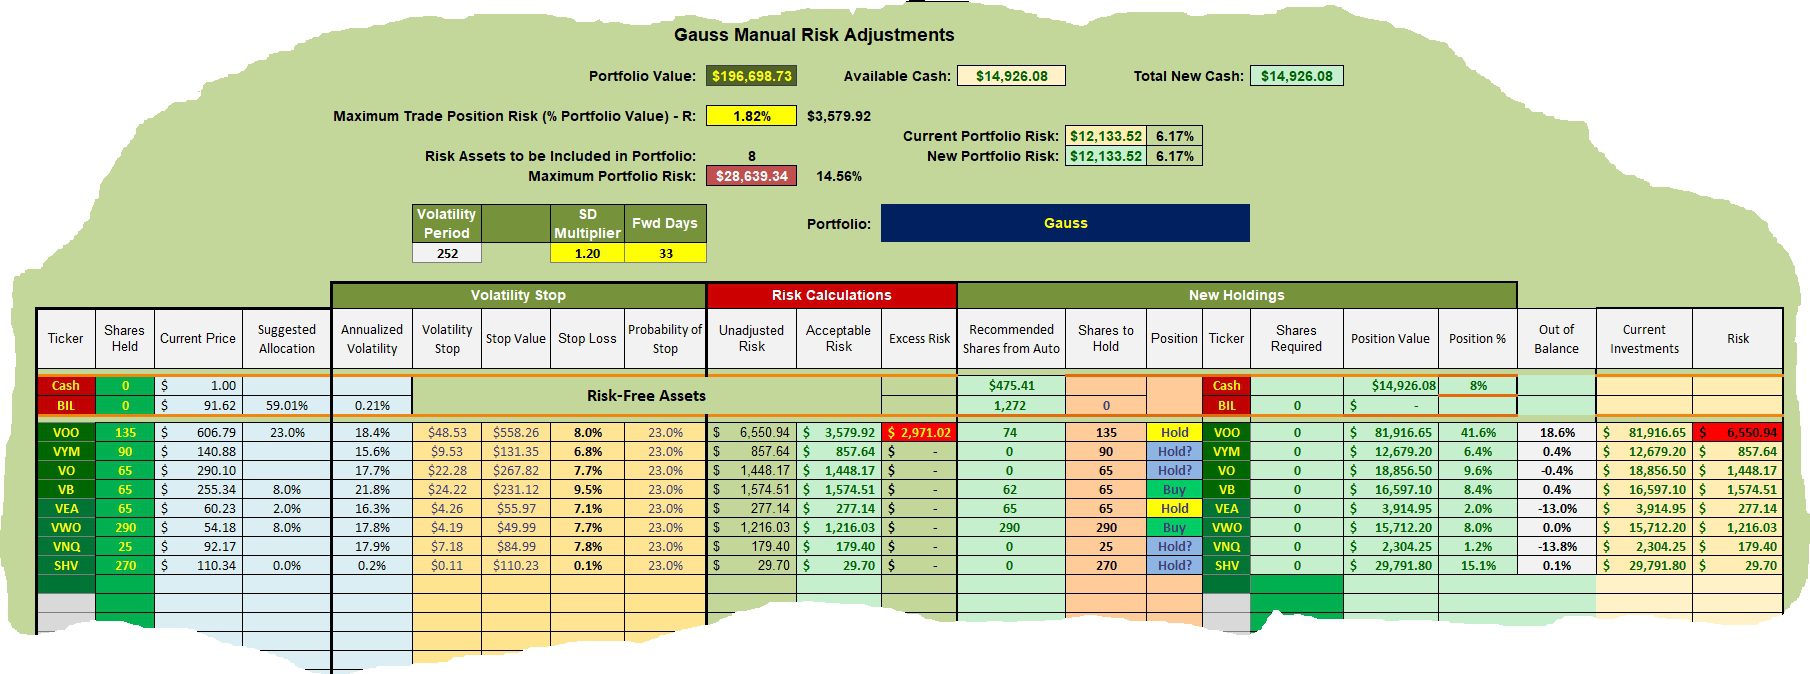
Gauss is another asset allocation portfolio that is undergoing a rebalancing process. This morning I sold off some shares of SHV so as to begin to rebuild the equity holdings such as VO, VB, VEA, VWO, and VNQ. See the process below.
Gauss Asset Allocation Model
Below are the current holdings for the Gauss portfolio. One major change is that I am replacing SCHD with VYM.
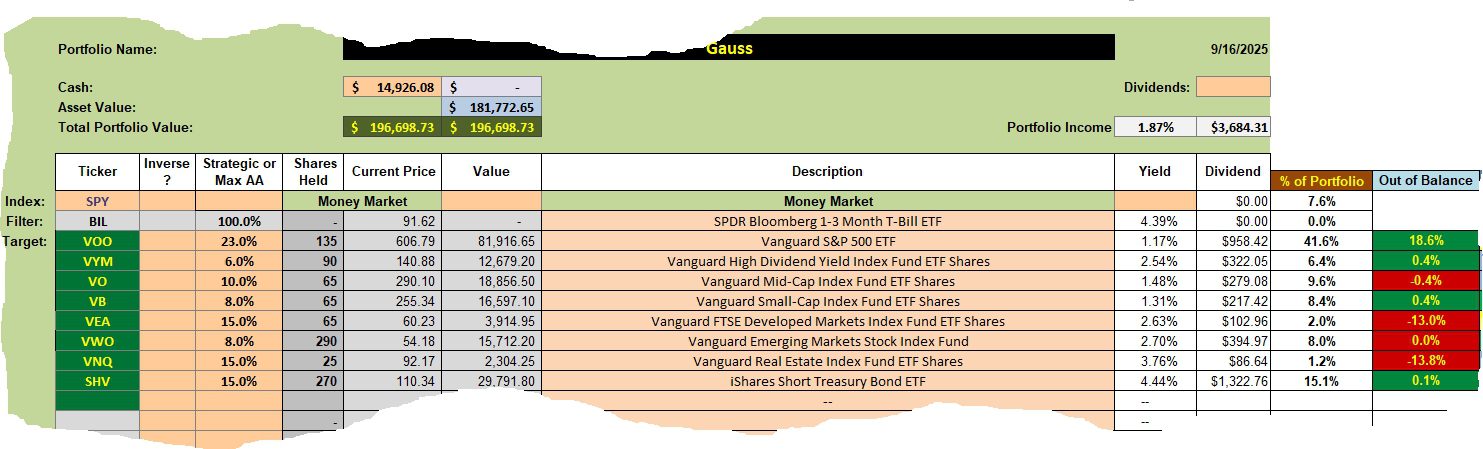
If anyone has a suggestion for a free cut and past software program for Windows, place your suggestion in the Comment section provided below.
Gauss Rebalancing Recommendations
Now that each asset class is holding a few shares, the next order of business it to keep any asset class with a Buy recommendation fully populated. Note the VB and VWO are within the recommended target percentage. “Within target” is defined as +/- 3.0% for a portfolio of this size. VOO is far above target, but I will not mess with that ETF. When possible I avoid selling shares. Rather, the goal is to continue to add shares of asset classes below target that also have a Buy recommendation.
In the next review, if VEA is still a Hold and far under the target percentage I will add shares.
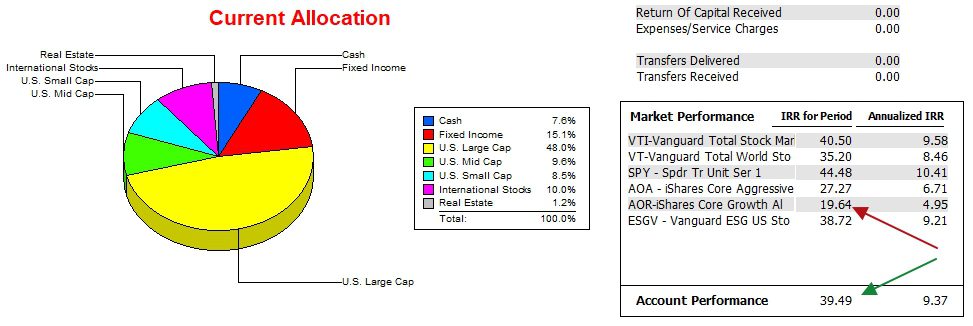
Gauss Performance Data
Since 12/31/2021 the Gauss has far outperformed the AOR benchmark, but lags the S&P 500. Topping SPY is a high bar.
Gauss Risk Ratios
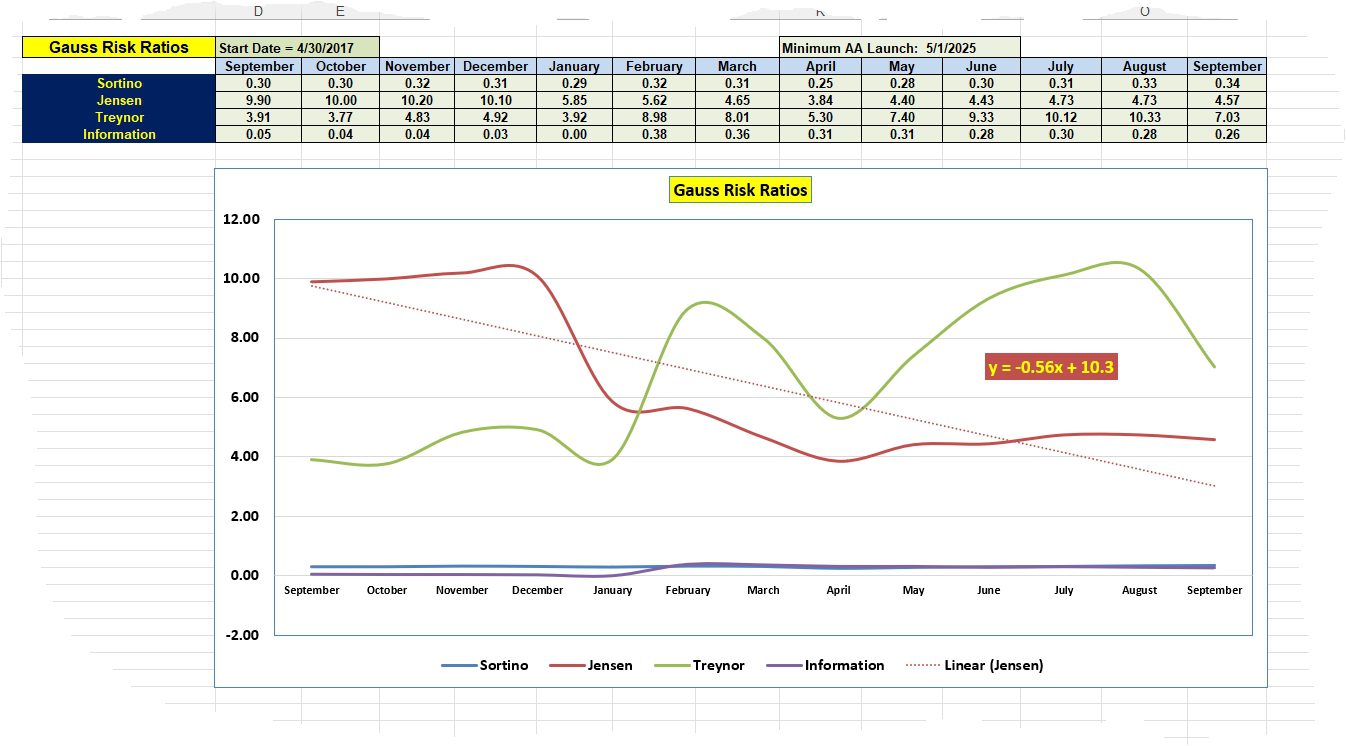
The September data shows the Gauss fell off slightly in all areas with exception of the Sortino Ratio. The portfolio is currently worth more that at anytime over the past year. That is the good news.
With the purchase of more shares of equity ETFs the beta of the portfolio increased. In other words, the risk is higher as equity holdings pose a higher risk vs. holding shares in a short-term treasury (SHV). This is the primary reason for seeing a decline in the Jensen Performance Index.
The dip from 0.28 to 0.26 in the Information Ratio (IR) indicates the Gauss did not keep pace with the AOR benchmark over the past month. However, the IR is much higher than it has been for most of the year.
Once we clear December the slope of the Jensen will not be quite so negative.
Comments and questions are always welcome.
Discover more from ITA Wealth Management
Subscribe to get the latest posts sent to your email.
I am concerned about the probability and potential duration of a government shutdown having a very adverse impact on financial markets. Here is why. Earlier, I used Google’s Gemini AI to estimate the probability of a shutdown. The prompt was constrained to use Superforecasting best practices. After reviewing the citations and reasoning, the probability range of 70% to 85% seemed believable. I then modified my prompt to accept that range and to forecast the duration range — it looks sufficiently long, 1 to 16 days, to be disruptive to financial markets. Here are the details:
“. . . A. The probability of a U.S. government shutdown beginning on or around September 30, 2025, is high, with a probability range between 70% and 85%. While a continuing resolution is being considered, there is a strong possibility that it will be blocked or delayed due to political disagreements over specific terms, such as health care subsidies and other budget items. The failure to pass any of the 12 full-year appropriations bills for fiscal year 2026, coupled with a thin congressional majority and deep partisan divides, increases the likelihood of a funding lapse.
B. Estimated Duration of the Shutdown
Given a 70% to 85% probability of a U.S. government shutdown, a reasonable range estimate for its duration is 1 to 16 days, with a higher probability of it lasting longer than previous short-term shutdowns. This is based on historical precedent and the current political climate.
Historical Context: Since the modern shutdown era began in the 1980s, the average duration of a U.S. government shutdown is about eight days. However, recent shutdowns have been longer, with notable examples including the 16-day shutdown in 2013 and the 35-day shutdown in 2018-2019. This suggests a trend toward lengthier standoffs due to more entrenched political positions.
Factors Influencing Duration: The duration of this potential shutdown will depend on the political motivations of the key players. The current standoff involves disagreements over health care policy, including expiring Affordable Care Act subsidies and Medicaid cuts. These are high-stakes issues that could extend negotiations. Both parties will be under immense pressure from the public, special interest groups, and financial markets to resolve the issue quickly, which may incentivize a faster resolution. However, if neither side is willing to compromise on their core demands, the shutdown could extend well into October. Past shutdowns have been resolved by passing a short-term continuing resolution, which is the most likely outcome, but the specific terms of such a resolution are the current sticking point.”
.
Lee,
Did you find any data as to stock declines as a result of a shutdown? Can we anticipate a 5%, 10% or higher decline in the value of stocks?
In most of the portfolios I am tracking there is a large percentage in treasuries. Holdings in SHV can quickly be converted into shares of VOO.
Lowell
I had thought of a question along those lines, but have not yet run a related prompt — I’ll try that and report back.
Meanwhile, on selecting CEFs, after several attempts I could not find a better way to select these for a portfolio than what you outlined a while back. In my opinion Steven Bavaria’s “The Income Factory” mentions the risk of a reversal of NAV to Price, leaving an investor stuck. However, the mention simply points out that risk and glosses over it without attempting a systematic risk management process, other than broad diversification.
Google Gemini AI generated list of shutdowns since 1980
“Based on the context and using superforecasting best practices, here is a list of U.S. government shutdowns since 1980, including their dates and durations. The shorter shutdowns during the Reagan administration are included, as they were also periods of funding gaps, though the impact was less widespread than the later shutdowns.
1980: 1 day (May 2-3)
1981: 2 days (November 20-23)
1982: 1 day (September 30 – October 2)
1982: 3 days (December 17-21)
1983: 3 days (November 10-14)
1984: 2 days (September 30 – October 3)
1984: 1 day (October 3-5)
1986: 1 day (October 16-18)
1987: 1 day (December 18-20)
1990: 3 days (October 5-9)
1995: 5 days (November 14-19)
1995-1996: 21 days (December 16, 1995 – January 6, 1996)
2013: 16 days (October 1-17)
January 2018: 3 days (January 19-22)
2018-2019: 35 days (December 22, 2018 – January 25, 2019)
.
Lee,
Most of the shutdowns you list above came during a time with Congress was less contentious. It might be worse this time.
Lowell