
Arches National Park
Gauss is the portfolio up for review this morning and we have the first Sell signal since setting up this Sector BPI portfolio. Follow along with the logic as to how well this might pan out for those using the Sector BPI model.
Sector BPI Data
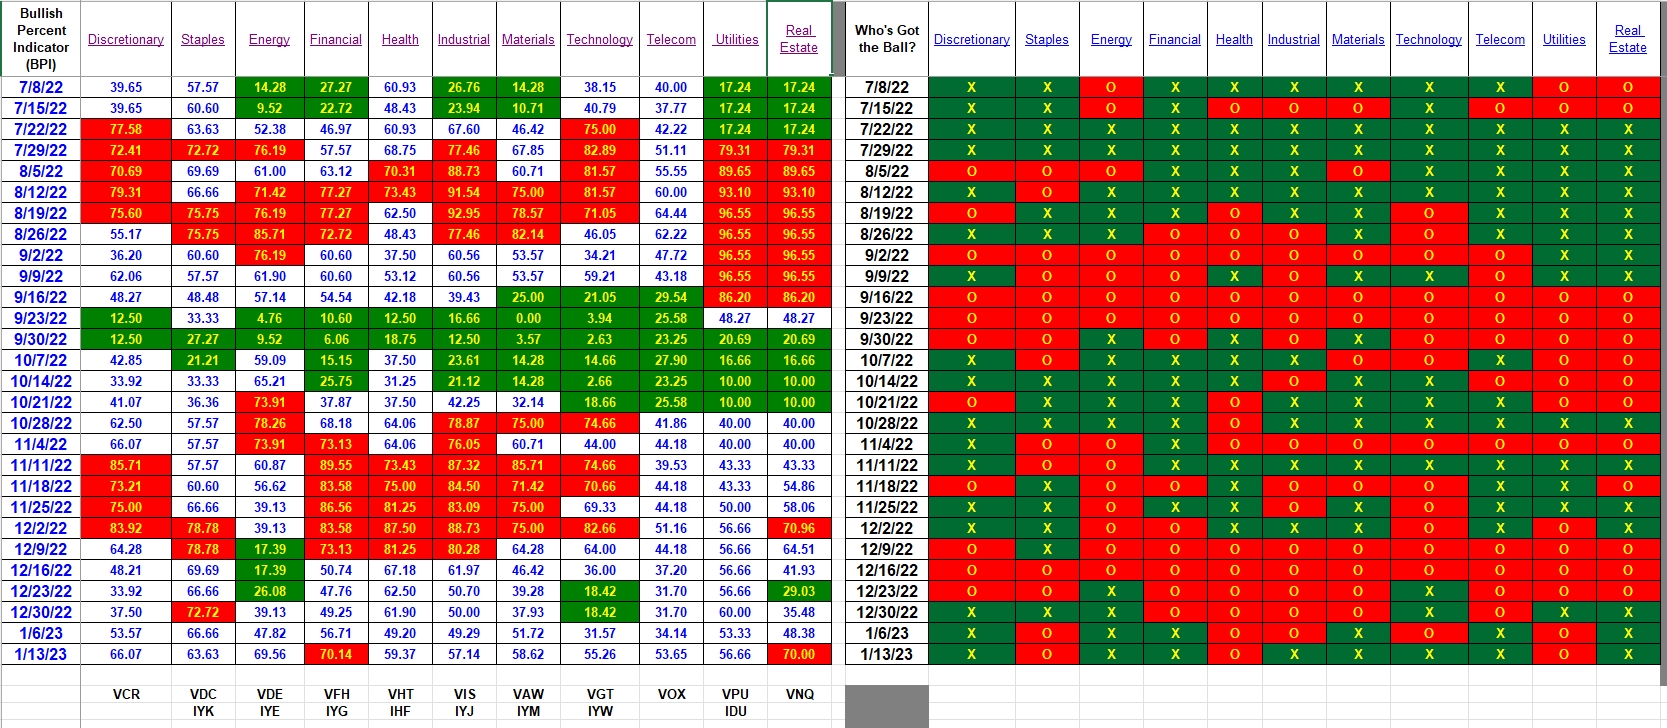
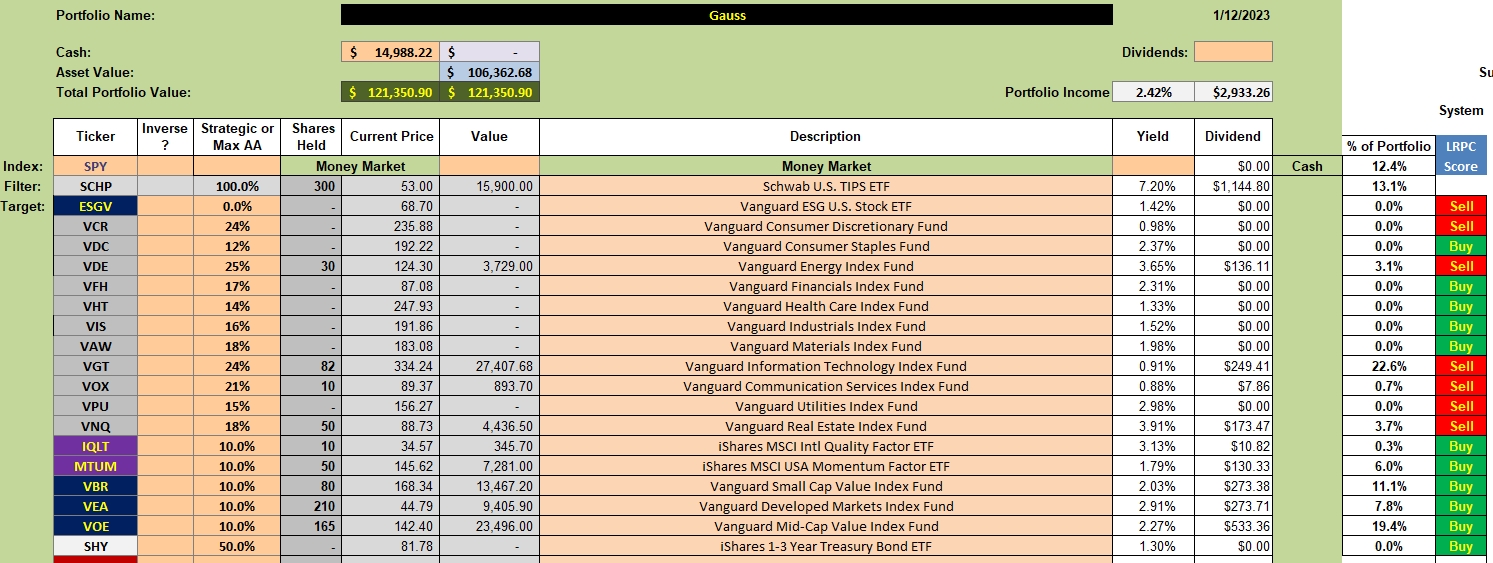
Below is the Bullish Percent Indicator data and you see that Real Estate and Financial sectors are over-bought. Since none of the ITA portfolios hold Financials (VFH) we can neglect that signal. However, the Gauss does hold VNQ or Real Estate. The current holding is 50 shares so a 3% TSLO is placed on those 50 shares. That TSLO position is in place as I write this blog.
Energy (VDE) is very close to a Sell signal as the BPI is pushing the 70% bullish position.
Gauss Sector Investment Quiver
I ran the numbers as the BPI for Real Estate hit the Buy zone on 12/23/2022 or just before Christmas. If one had set a purchase order the following Tuesday when the market opened, the price closed at $82.71 that day. Using the closing price yesterday, a TSLO is set when the price was $88.73. Using a 3% TSLO, the sell price is close to 0.97 x $88.73 = $86.07. The move from a buy price of $82.71 to a sell price of $86.07 leaves a profit of 4.0% over a very short period.
If this same scenario works each time a sector moves between a Buy and Sell zone, the Sector BPI model will be a success. The larger question remains, will these transactions outperform the S&P 500 if one were to hold SPY and do nothing. The Copernicus is such a portfolio so we will be able to compare the Sector BPI portfolios against both the Copernicus and Schrodinger portfolios.
This Sector BPI model experiment is such where we can compare performance against a benchmark such as AOA, but also compare performance against the Copernicus and Schrodinger. We can also compare the risks we are taking and compare against the Copernicus and Schrodinger as well as the other investing models.
Gauss Performance Data
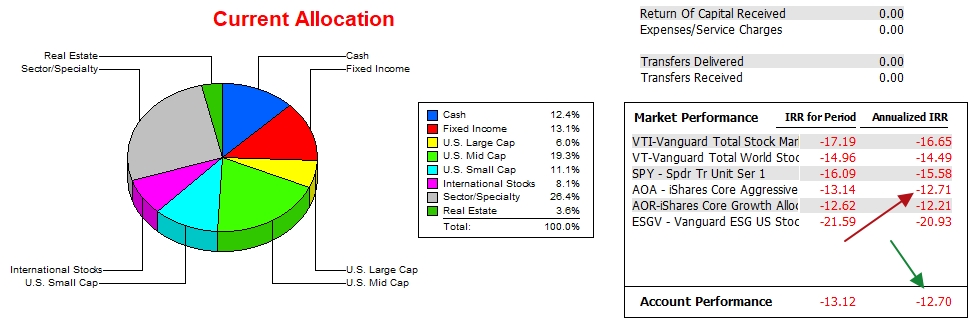
Over the past year the Gauss is matching the AOA benchmark and outperforming the S&P 500 as well as all other benchmarks with exception of the AOR. AOR holds more bond type securities compared to AOA and that is why it is edging out the AOA during this period when equities are under-performing.
Gauss Risk Ratios
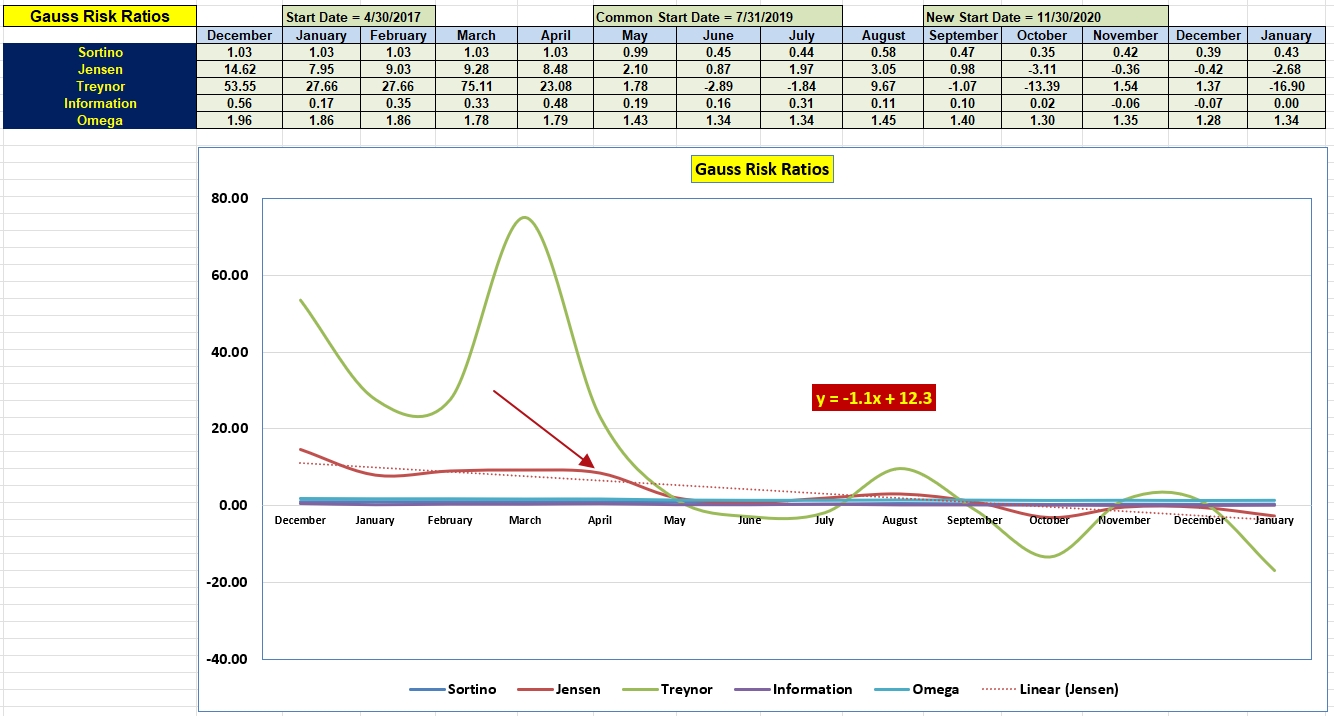
Even as the Gauss is matching the AOA benchmark, the risk involved is higher so the Jensen took a hit between December of 2022 and January of 2023. In another six months to a year we will have a better idea as to how well the Sector BPI model is performing.
The ITA Wealth Management blog is now free to all who register as a Guest.
If you have any Comments or Questions, post them in the Comment section provided below. General questions can also be posted in the Forum section of the ITA blog.
Discover more from ITA Wealth Management
Subscribe to get the latest posts sent to your email.
With Energy (VDE) nearly hitting the 70% bullish mark I set a 3% TSLO to sell 30 shares of VDE.
Lowell
Hi Lowell,
I’m enjoying your lessons. Two questions come to mind:
1. What is the reason no portfolios contain financials?
2. Does your dividend yield column depict monthly income? Or annual? I’m wondering how the income can reach a total of $2933 in one month? Is that all dividends?
Thanks again.
TF
TF,
The above Gauss portfolio is one of four Sector BPI accounts. Financials (VFH) is available for purchase when it shows up as a Buy. Based on current Bullish Percent Indicator data, Financials are not a Buy. That is the reason it does not hold any shares at this time. Tomorrow I will post a complete update of BPI data and at that time you will be able to see if VFH is a Buy or not.
The dividends are annualized. That is how the income reaches the nearly $3,000 level for the Gauss. Depending on the action during the year, the income might exceed or miss this total.
Lowell
Gauss holds 50 shares of VNQ, one of the sectors currently in the Sell zone. I have a 3% TSLO set for VNQ so no additional information is needed at this time (1/19/23).
Lowell