
Covid 19 Outdoor Expansion at Fat City
Carson is one of four Sector BPI Plus portfolios and is the oldest among this management style. Each review we add a bit more historical data to this unique management model. In the following analysis I attempt to explain clearly how the Sector BPI model works. If there are any questions or comments, drop them in the Comment section provided with each blog entry.
Carson Investment Quiver
Before going further, there is an error in the Max AA percentage for VDE. It should be 24.8% instead of 11.5%. This percentage will change each month as the ETF percentage is calculated based on a 3-yr volatility value. I set the coefficient so the highest sector percentage comes in around 25% of the total portfolio. The current 23% VDE occupies is nearly the exact percentage recommended. The Carson has held this percentage of VDE for some time so the latest BPI recommendation, where Energy (VDE) is approaching the Buy zone, does nothing to change the Carson. This portfolio already holds sufficient shares of VDE.
Telecom is the sector currently recommended for purchase. As the portfolio now stands, we need to add a few more shares of VOX to bring it up to the 20% level.
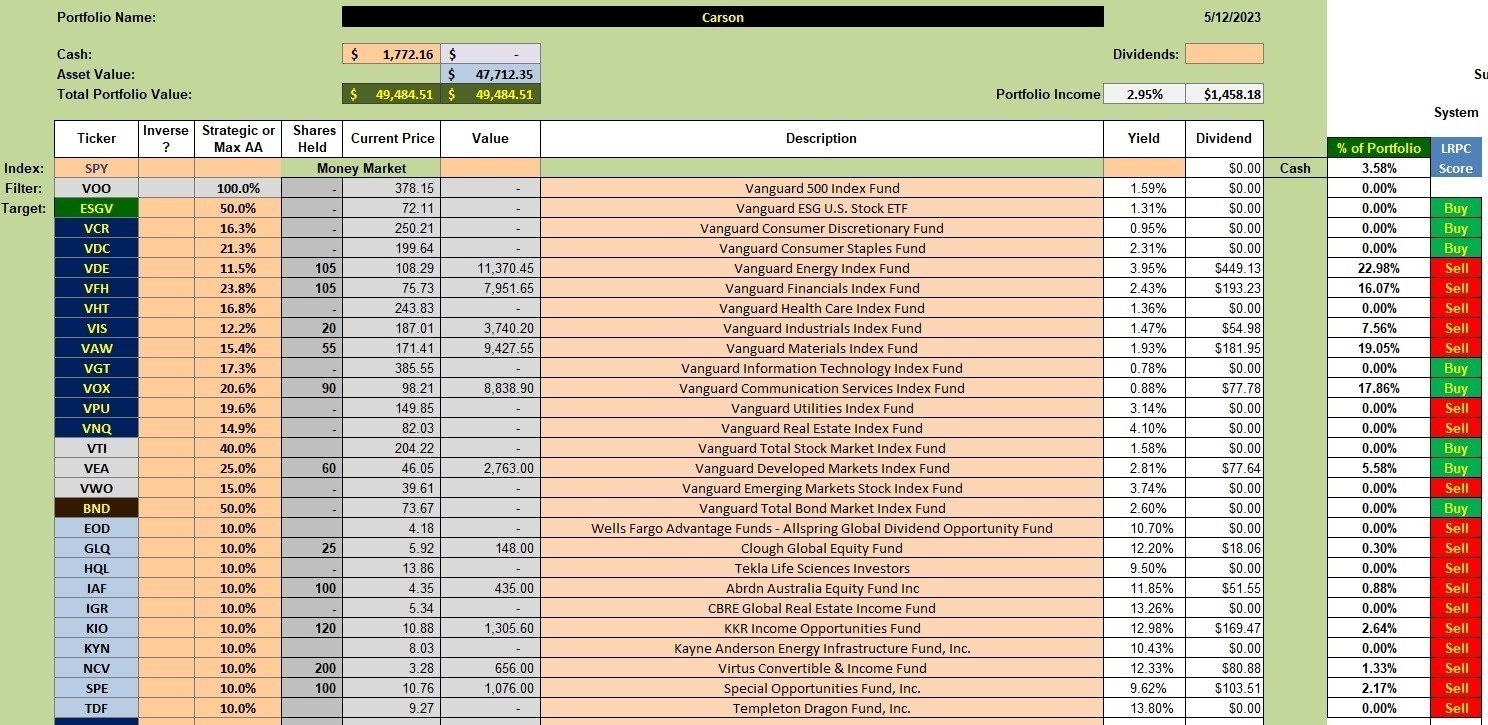
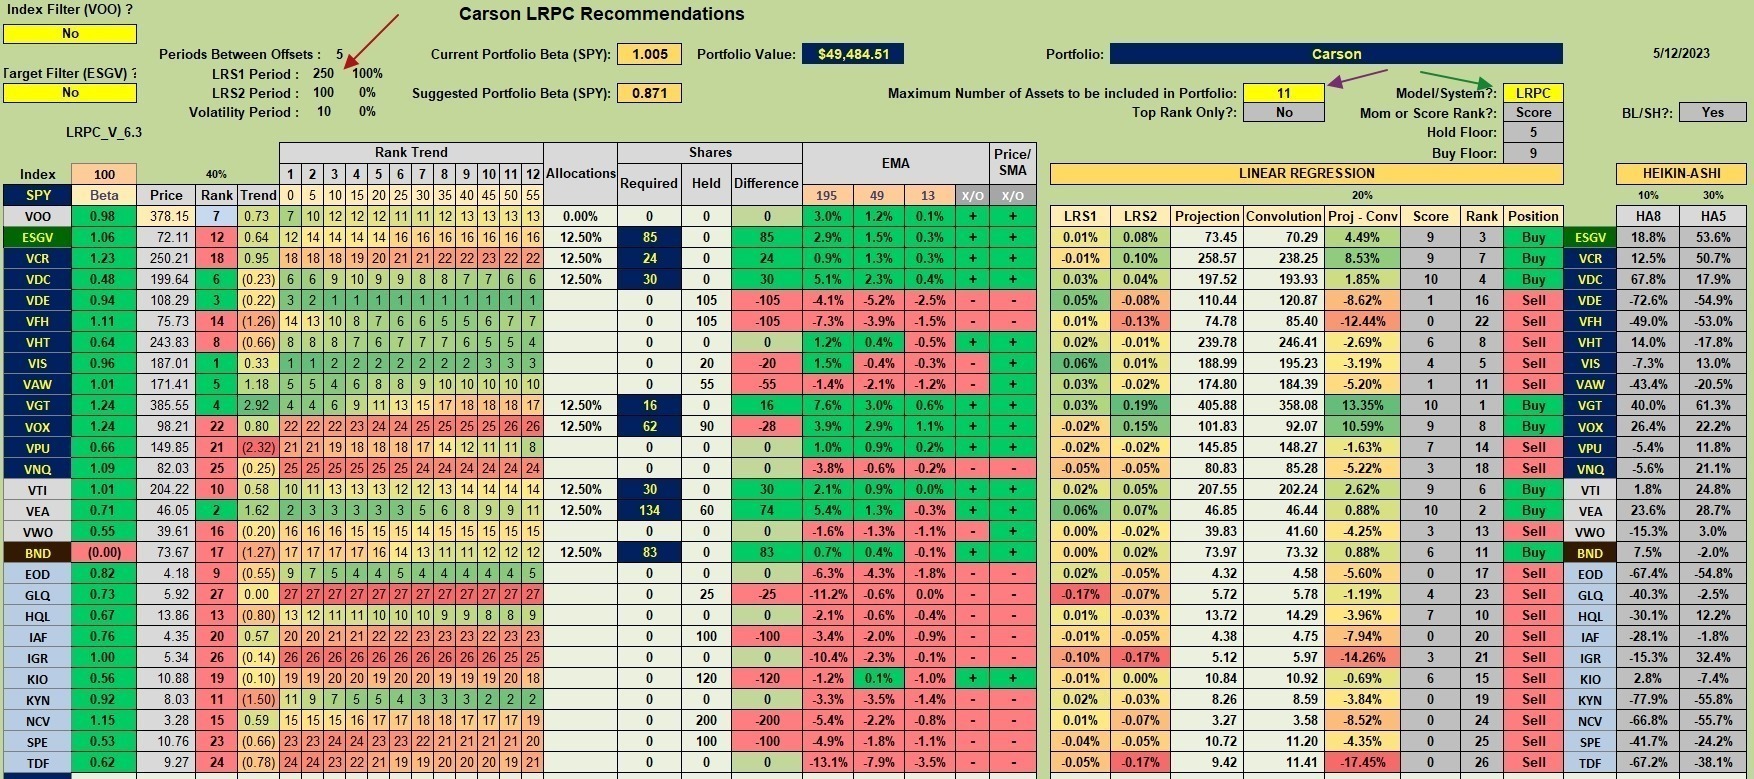
Carson Security Recommendations
Remember the order in which recommendations are followed.
- Following the BPI percentages we first fill the sector recommendations. Currently, only Telecom is calling for a Buy.
- If cash is available we move down to the Dual Momentum™ section of the portfolio. We see that both VTI and VEA are recommended. Since the DM model recommends only one security at a time we select the highest ranking ETF. That is VEA as we see from the fourth column from the left.
- If cash is still available we purchase an array of CEFs. Currently the Carson holds shares in five different CEFs. We will pick up dividends at the end of May from these CEFs and more when the second quarter ends in June.
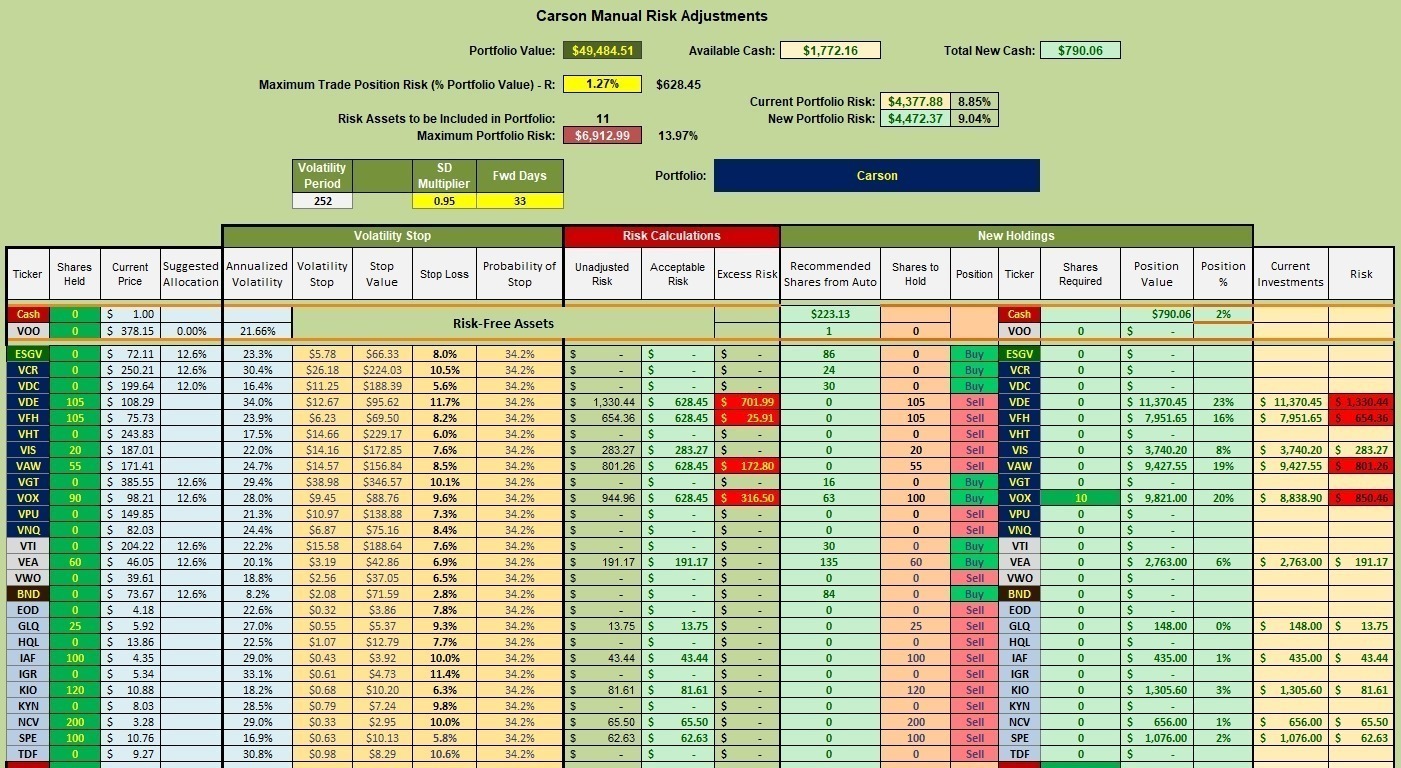
Carson Manual Risk Adjustments
Adding 10 shares of VOX will bring Telecom up to the 20% level. That leaves approximately $800 in cash. I’ll most likely add a few shares of CEFs to use up the remaining cash.
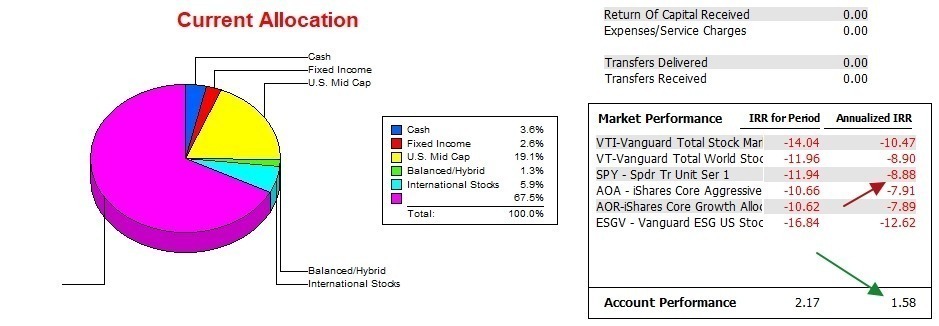
Carson Performance Data
Since the end of April the Carson dropped when measuring the Internal Rate of Return (IRR), yet it maintains a significant lead over the S&P 500 (SPY). The Carson is also outperforming all other possible benchmarks over the past 16.5 months.
The large unidentified purple part of the pie chart is mainly CEFs.
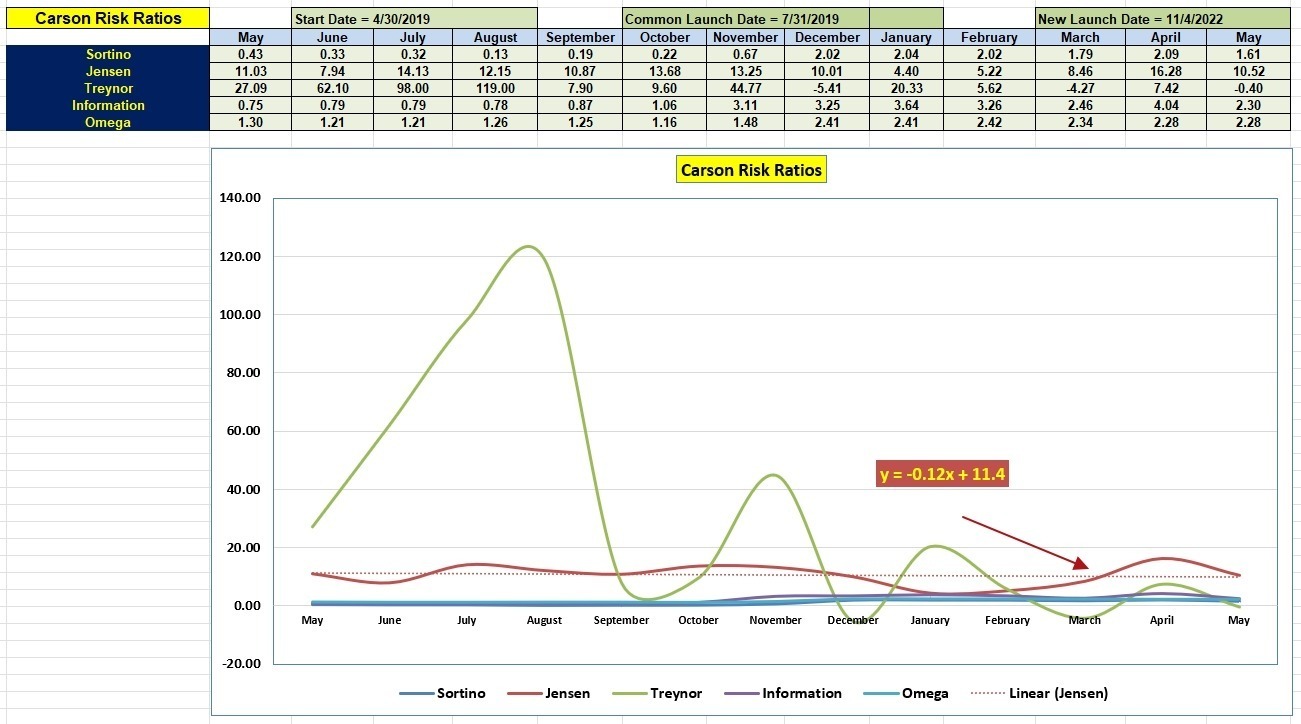
Carson Risk Ratios
Once we clear August that Treynor peak will allow other parts of the graph to show up more clearly. The Jensen Alpha is still a very high value, but off the April high.
As I recall, I launched the Carson last November so we still have many months to go before we have a better idea as to how the Sector BPI model performs. Thus far the model has not disappointed, but I want the slope of the Jensen to return to a positive value.
New Carson Launched: 4 November 2022
Buying Guidelines For BPI Model Portfolios: 9 December 2022
Gauss Portfolio Update: 19 March 2023
Discover more from ITA Wealth Management
Subscribe to get the latest posts sent to your email.
Even though Energy (VDE) is close to a Buy, I did not add shares to the Carson as it is fully populated with VDE.
Lowell
Lowell,
What is meant by “Maximum Portfolio Risk” of $6912.99?
Hedgehunter can answer this better than I, but I’ll take a swipe at answering.
One variable I control is the Maximum Trade Position Risk or 1.27% in the above example. The Portfolio Value multiplied by 1.27% yields $628.45. I think of that as the risk for each potential security.
In this portfolio I permit as many as 11 securities for investment. 11 x $628.45 = $6912.99 or the Maximum Portfolio Risk.
Now return to the 1.27% or a percentage the manager controls. Sometimes I will max that percentage so the remaining Total Cash ends up below $200 or even lower. When one seeks to invest all available cash, the risk of the portfolio rises.
Sometimes I will lower the 1.27% to something where the maximum portfolio risk is 5% or 6% instead of the current 10.16%. Setting the percentage to 1.27% I am playing a high risk game as the overall portfolio risk is now greater than 10%.
The cell where you see 1.27% in the above example is a critical variable as it “controls” how much risk one is willing to take with the portfolio.
Hope this helps, and Hedghunter, if you can add to my explanation, please chime in.
Lowell