
Winter Sunrise in Oakville, Ontario, Canada
I will start this post with my usual weekly look at US Equity markets through the eyes of the S&P 500 Index (SPX):
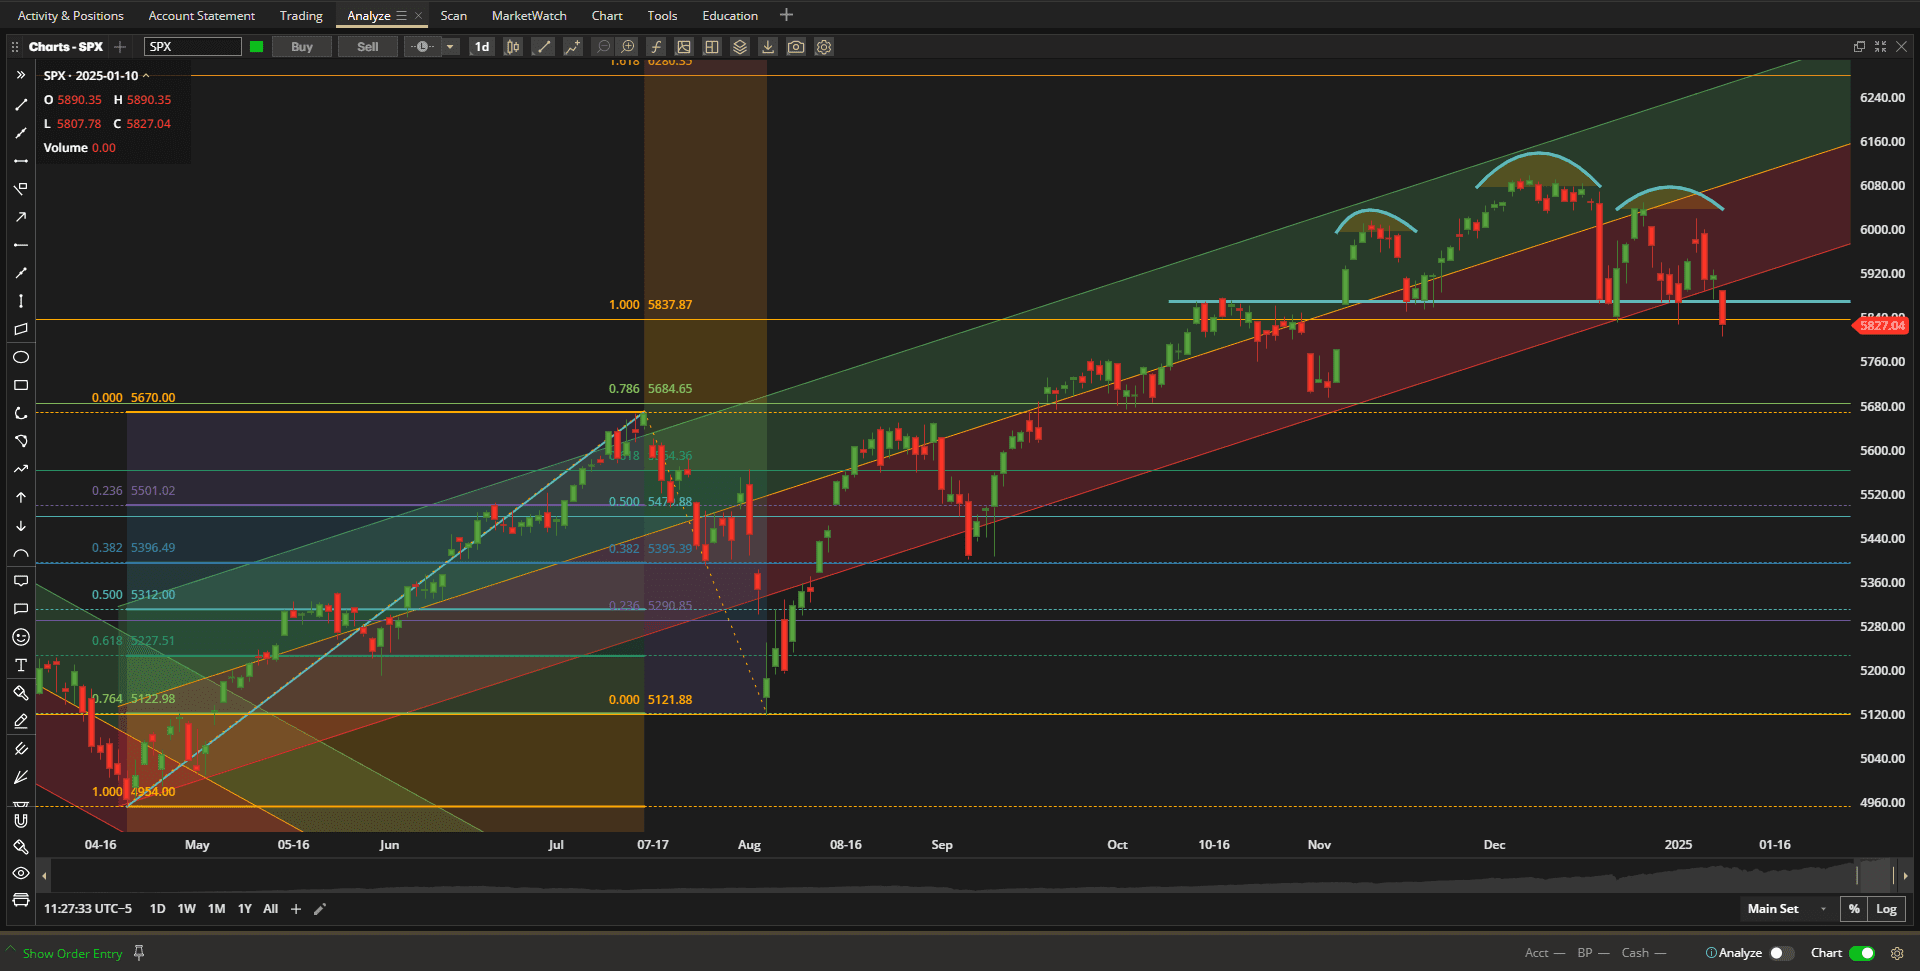
where we see that, after starting the week strongly on Monday, the markets deteriorated badly going into the end of the week. We are now sitting on that neckline support/resistance line that we have been watching for the past few weeks. In fact, we closed slightly below the 5840 level and might be looking at a test of the 5680 level if we see a continuation of this pullback.
In terms of relative performance, asset classes in the “new” Rutherford-Darwin Portfolio look like this:
 with only Oil and Silver showing positive returns over the past week.
Although I plan to Review the Rutherford-Darwin Portfolio as a single portfolio it is really three portfolios (3) combined into one. The reason for presenting it this way is to demonstrate how diversified strategies can be combined to generate desired returns whilst (hopefully) keeping wealth risk to a minimum and acceptable overall volatility.
The Rutherford-Darwin (R-D) Portfolio starts out with $70,000 to invest. Of this $70,000, I will start by allocating $50,000 to “risk-free” investments – at the present time this will be to BIL – the 1-3 month T-Bill ETF that is paying ~5% yield. So, right off the bat, I have limited the total portfolio risk to less than 30% and a 30% Draw-Down – and this portion will need little or no monitoring other than to check, occasionally, that there are no better “risk-free” alternatives.
Darwin (https://itawealth.com/rutherford-portfolio-review-part-1-3-january-2025/)
For the second portion of the portfolio – that I will refer to as the Darwin portion – I have allocated a nominal $10,000 to a classical portfolio of nine ETFs covering all the major asset classes and with a wide range of correlation between the asset classes. Allocations to each ETF are based on Risk Parity (i.e. more volatile ETFs are allocated less funds than lower volatile ETFs) and, on top of this, I have set a very modest 2% (of the $10,000) volatility target for each ETF. Thus, I anticipate experiencing low volatility – less than ~10% – in this portion of the portfolio. I do not anticipate making a lot of adjustments – maybe quarterly if allocations get seriously out-of-balance – unless market conditions are obviously changing significantly. Otherwise, this will be a Buy-And Hold portfolio with holdings in all nine (9) ETFs.
The initial holdings look like this:
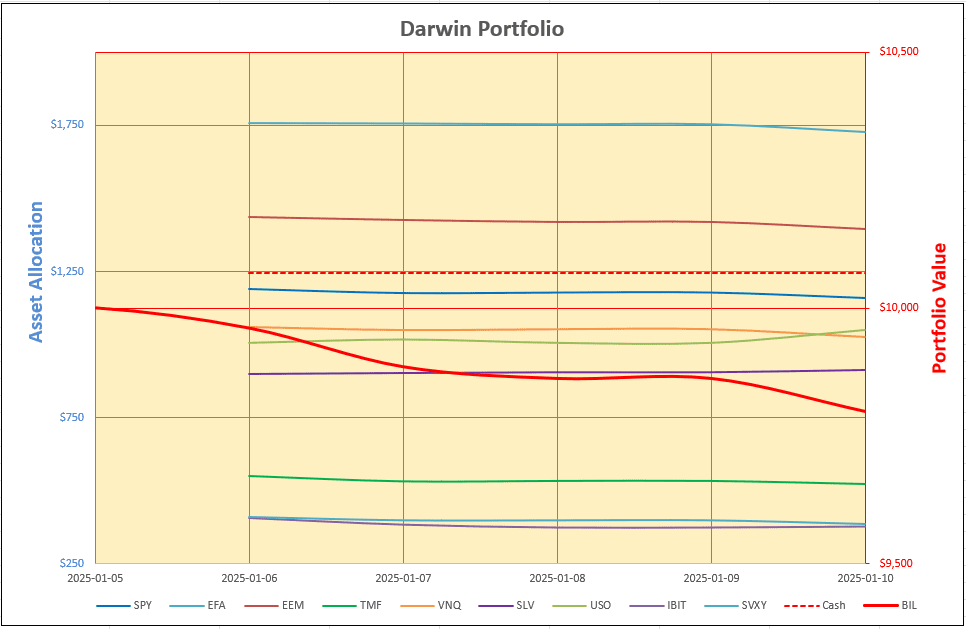
With individual holdings shown along the left-hand axis and total Portfolio Value shown by the heavy red line and values on the right-hand axis.
As can be seen above, more funds are allocated to EFA and EEM (International Equities) than to IBIT or SVXY (Cryptocurrency and Volatility ETFs) and the portfolio is not fully invested, with ~$1,250 in Cash. If I wish to be fully invested I will simply increase the target volatility level to, say, 2.5% or 3%. I’ll start here and see how things go.
Obviously, this portion of the portfolio did not get off to a great start as it was a bearish start to 2025 with only Oil (USO) and Silver (SLV) showing positive returns as noted in the second screenshot above.
Rutherford (https://itawealth.com/rutherford-portfolio-review-part-2-options-6-january-2025/)
The last $10,000 I will use to buy Options on the same 9 ETFs chosen for the Darwin portion of the portfolio – but I will make discretionary decisions depending on whether I feel bullish (when I will buy Call Options) or bearish (when I will buy Put Options) on each ETF. I will attempt to limit my risk here to less than $1,000 on each ETF in which I am holding a position. I will not always be holding a position in all nine ETFs – if I am neutral in my belief as to which way prices may move, I will stay out of the market. Because Options are derivative products they are leveraged instruments and, as such, we can expect significantly more volatility in this portion of the portfolio.
Initially, I have opened one bullish position – buying Call Options in USO (Oil) – and four bearish positions, buying Put Options in EFA and EEM (International Equities) and in VNQ (Real Estate) and TMF (Treasury Bonds). I am currently neutral on the other ETFs/asset classes so have no position.
Performance of the holdings to date looks like this:
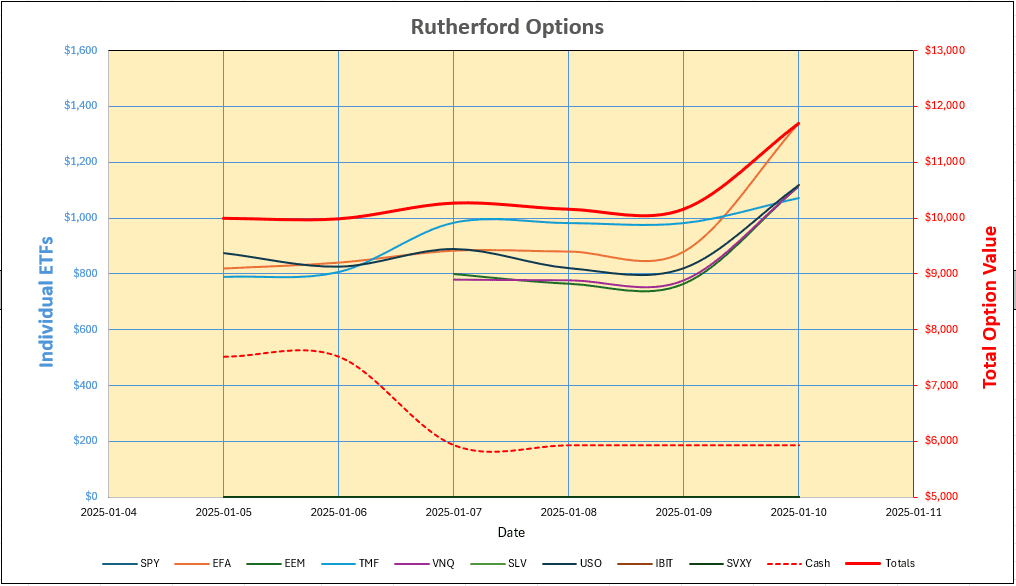
and we are off to a nice start with $1,695 profit on investments of ~$4,000 in 5 days. The remaining $6,000 balance is in Cash. Of course, we cannot expect this to continue and, as mentioned above, we can expect to see a lot of volatility in this portion of the portfolio.
Putting the three segments together, this is what the overall total picture looks like:
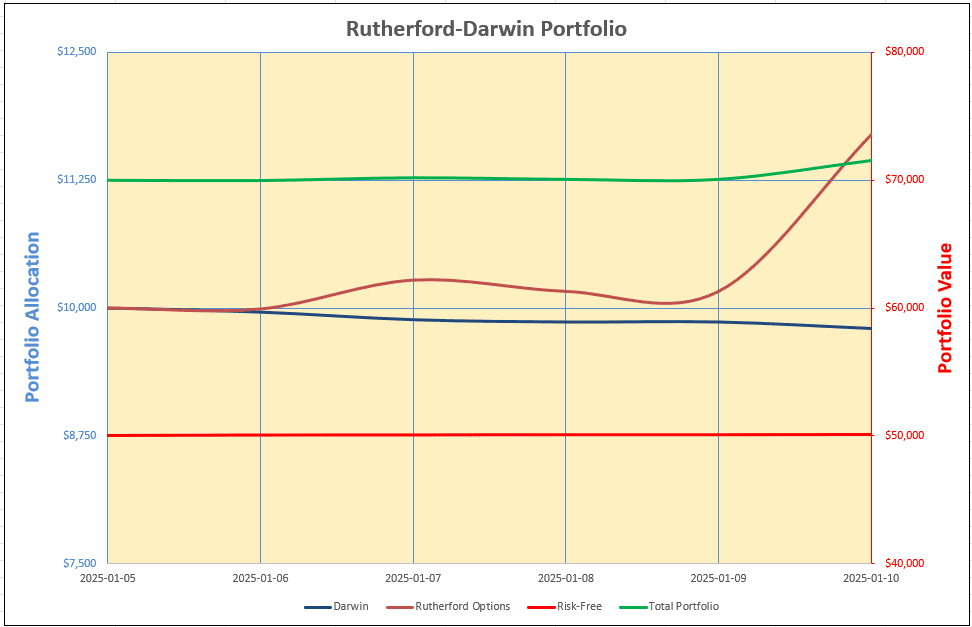
With the Darwin and Rutherford portions shown in dark blue and brown, with values on the left-hand axis, and the “risk-free” and Total Portfolio shown in red and green, with values on the right-hand axis.
What we would like to see is a nice green total portfolio equity curve with relatively low volatility. I am not sure how easy it will be to show the component contributions going forward as adjustments are made – primarily to the Rutherford Options portion of the portfolio – but I’ll worry about that when we get there.
Let me know if you have any ideas as to how I might make this simpler/clearer going forward – or any other comments you might have regarding the idea of combining different strategies.
Update: 13 January 2025
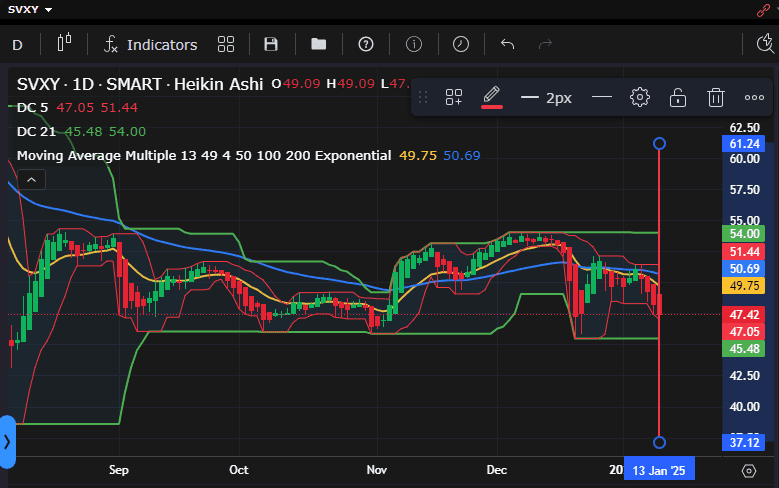
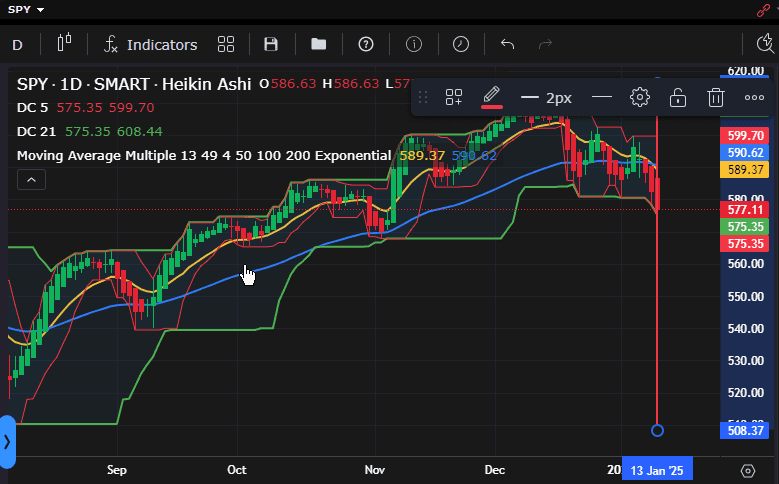
With the markets looking weaker again this morning I have now gone bearish on SVXY (expecting Volatility to increase):
 and SPY:
I have purchased two (2) $49 Strike Put Options, expiring 21 March (in 67 Days – a little further out in time than the Options that I purchased last week), in SVXY for 3.50 ($700). These Options have a “Delta” of ~ -0.52 and so the position is equivalent to being short 100 shares.
I have also bought one (1) $590 Strike Put Option, expiring on February 28 (in 46 Days), in SPY for 18.62 ($1,862). I am not totally comfortable with the SPY Option since it is an expensive Option due to the fact that SPY is an expensive ETF (~$580) and the maximum risk is ~$1,800 rather than ~$800 as for most of my other positions. I would have preferred to keep risk at the same level for all holdings – but I can’t find a lower cost ETF tracking the US Equity markets with the same level of liquidity as SPY. But, with a “Delta” of ~-0.63, this is equivalent to being short 63 shares of SPY valued at ~63 x $580 = ~$30,000 – significant leverage with ~6% (of $30,000) risk! We’ll see how this goes – I may have to switch to a lower cost, but less liquid ETF, like VTI.
Update: 15 January 2025
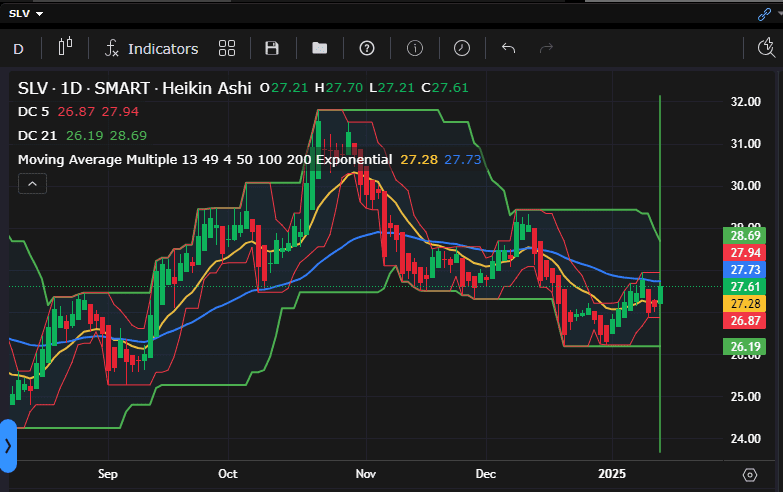
I have opened a bullish position in Silver (SLV) in the Options portion of the portfolio by buying 4 contracts of the $26 Strike Call Options, expiring 28 February (44 days) at 1.95 ($780). These Options have a Delta of ~0.80 – so the position is equivalent to holding 320 shares.
I may be a little early getting in here, but, since most of my positions are bearish I wanted to even things out a little – SLV is moving higher after pulling back to a higher low:
Discover more from ITA Wealth Management
Subscribe to get the latest posts sent to your email.
This post is updated above to include 2 new bearish positions in the Rutherford-Options portion of the portfolio.